20070201
u To draw and analyze the asymptotes [G-SLV]-[ASYM]
Example To draw the asymptotes for the hyperbola
Use the following V-Window settings.
Xmin = –6.3, Xmax = 6.3, Xscale = 1
Ymin = –5, Ymax = 5, Yscale = 1
m CONICS
ccccccc w
c w c w b w b w6 (DRAW)
!5 (G-SLV)
5 (ASYM)
(Draws the asymptotes.)
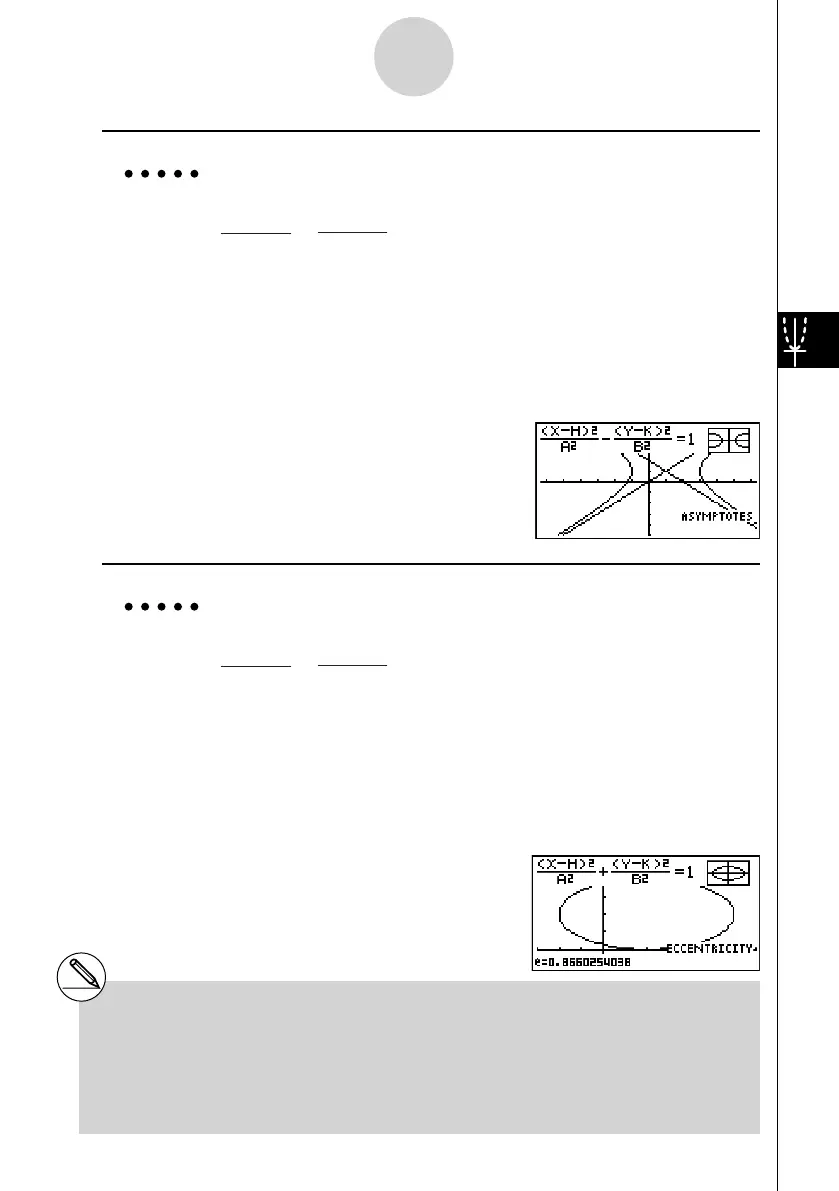
u To calculate eccentricity [G-SLV]-[e]
Example To determine the eccentricity of the graph for ellipse
Use the following V-Window settings.
Xmin = –3, Xmax = 7, Xscale = 1
Ymin = –1, Ymax = 5, Yscale = 1
m CONICS
cccccc w
e w c w c w c w6 (DRAW)
!5 (G-SLV)
6 (g )1 (e)
(Calculates eccentricity.)
(X – 1)
2
–
(Y – 1)
2
= 1
2
2
2
2
(X – 1)
2
–
(Y – 1)
2
= 1
2
2
2
2
(X – 2)
2
+
(Y – 2)
2
= 1
4
2
2
2
(X – 2)
2
+
(Y – 2)
2
= 1
4
2
2
2
# Certain V-Window parameters can produce
errors in values produced as graph analysis
results.
# The message ”Not Found” appears on the
display when graph analysis is unable to
produce a result.
# The following can result in inaccurate analysis
results or may even make it impossible to obtain a
solution at all.
- When the solution is tangent to the
x -axis.
- When the solution is a point of tangency
between two graphs.
5-11-22
Function Analysis