E-39
Command Calculation Formula
Correlation Coefficient
r
r =
Sxx
.
Syy
Sxy
However,
Command Calculation Formula
Estimated Value
m
m =
y – a
b
Estimated Value
n
n = a +
x
b
k
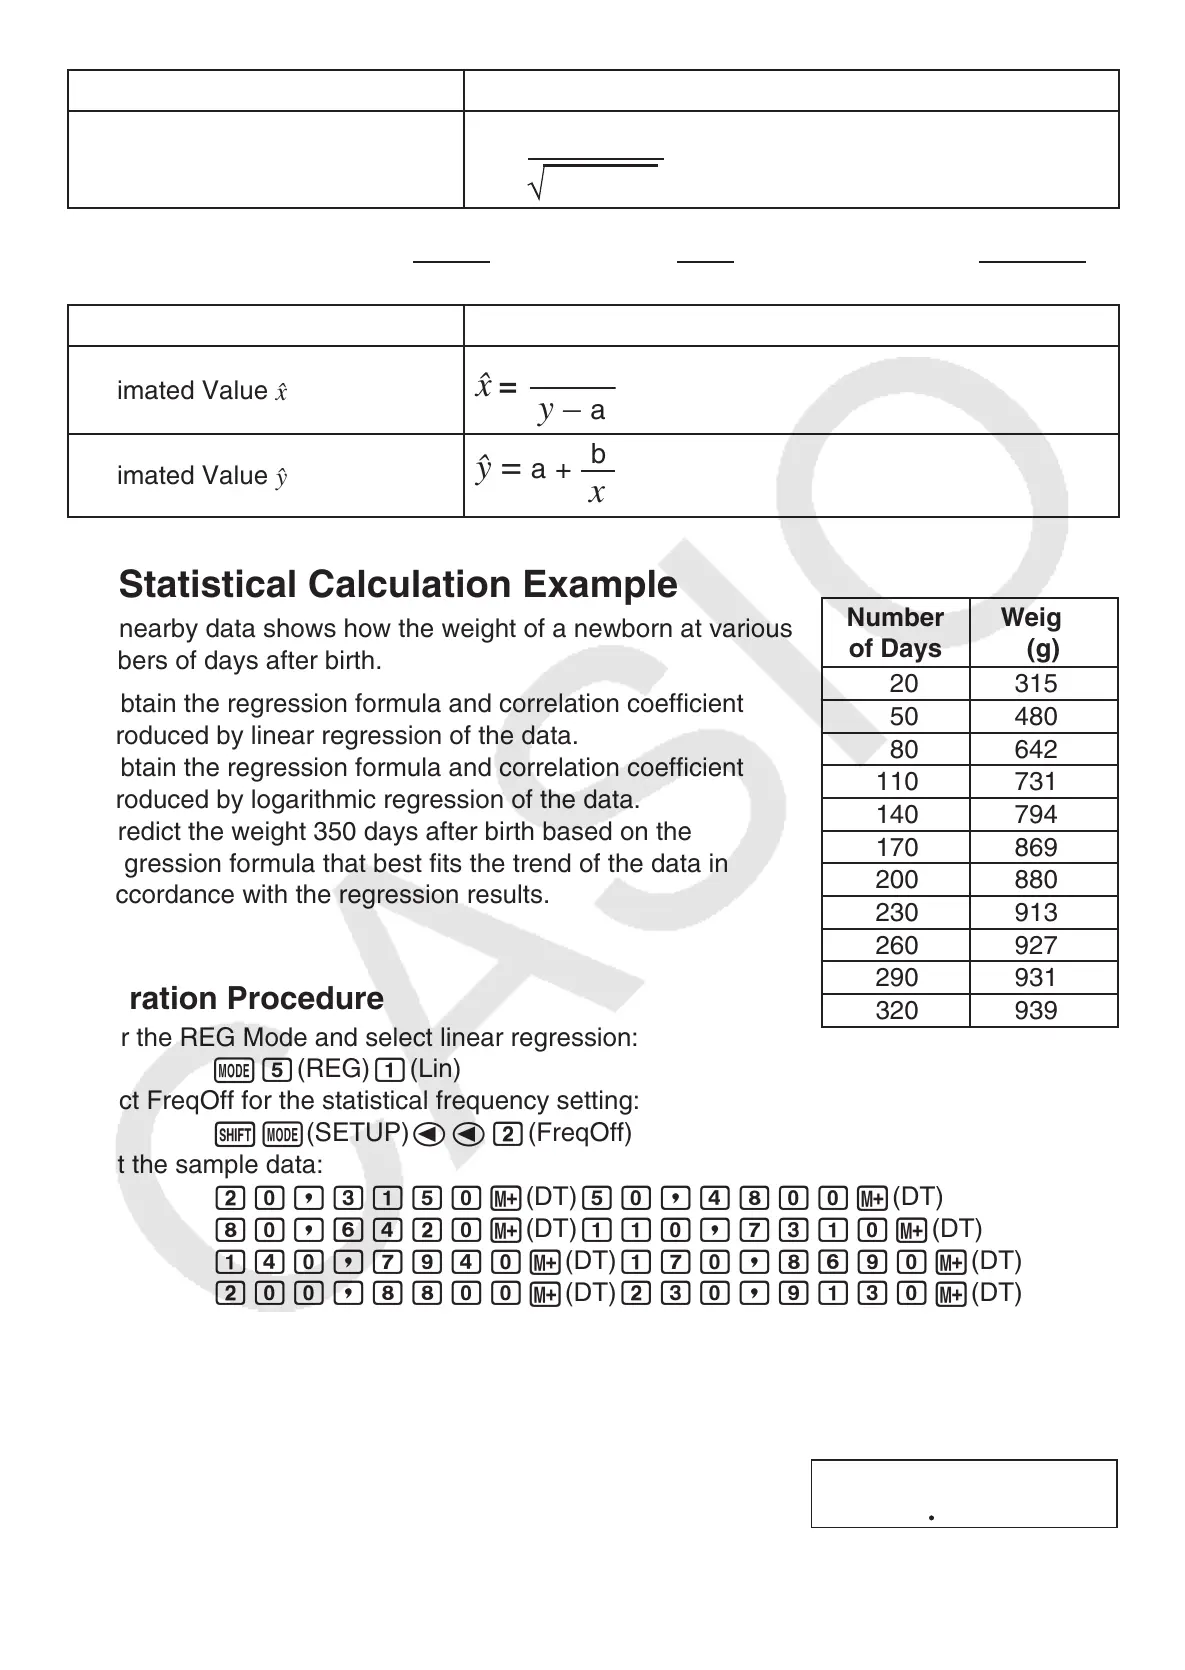
Statistical Calculation Example
The nearby data shows how the weight of a newborn at various
numbers of days after birth.
1
Obtain the regression formula and correlation coefficient
produced by linear regression of the data.
2
Obtain the regression formula and correlation coefficient
produced by logarithmic regression of the data.
3
Predict the weight 350 days after birth based on the
regression formula that best fits the trend of the data in
accordance with the regression results.
Operation Procedure
Enter the REG Mode and select linear regression:
N
5
(REG)
1
(Lin)
Select FreqOff for the statistical frequency setting:
1N
(SETUP)
dd
2
(FreqOff)
Input the sample data:
20,3150
m
(DT)
50,4800
m
(DT)
80,6420
m
(DT)
110,7310
m
(DT)
140,7940
m
(DT)
170,8690
m
(DT)
200,8800
m
(DT)
230,9130
m
(DT)
260,9270
m
(DT)
290,9310
m
(DT)
320,9390
m
(DT)
1
Linear Regression
Regression Formula Contant Term a:
1
2
(S-VAR)
1
(VAR)
ee
1
(a)
E
Sxx = Σ(x
i
–1
)
2
–
n
(Σx
i
–1
)
2
Syy = Σy
i
2
–
n
(Σy
i
)
2
Sxy = Σ(x
i
–1
)y
i
–
n
Σx
i
–1
.
Σy
i
Number
of Days
Weight
(g)
20 3150
50 4800
80 6420
110 7310
140 7940
170 8690
200 8800
230 9130
260 9270
290 9310
320 9390
4446575758

 Loading...