36
DATA DISPLAY SCREENS
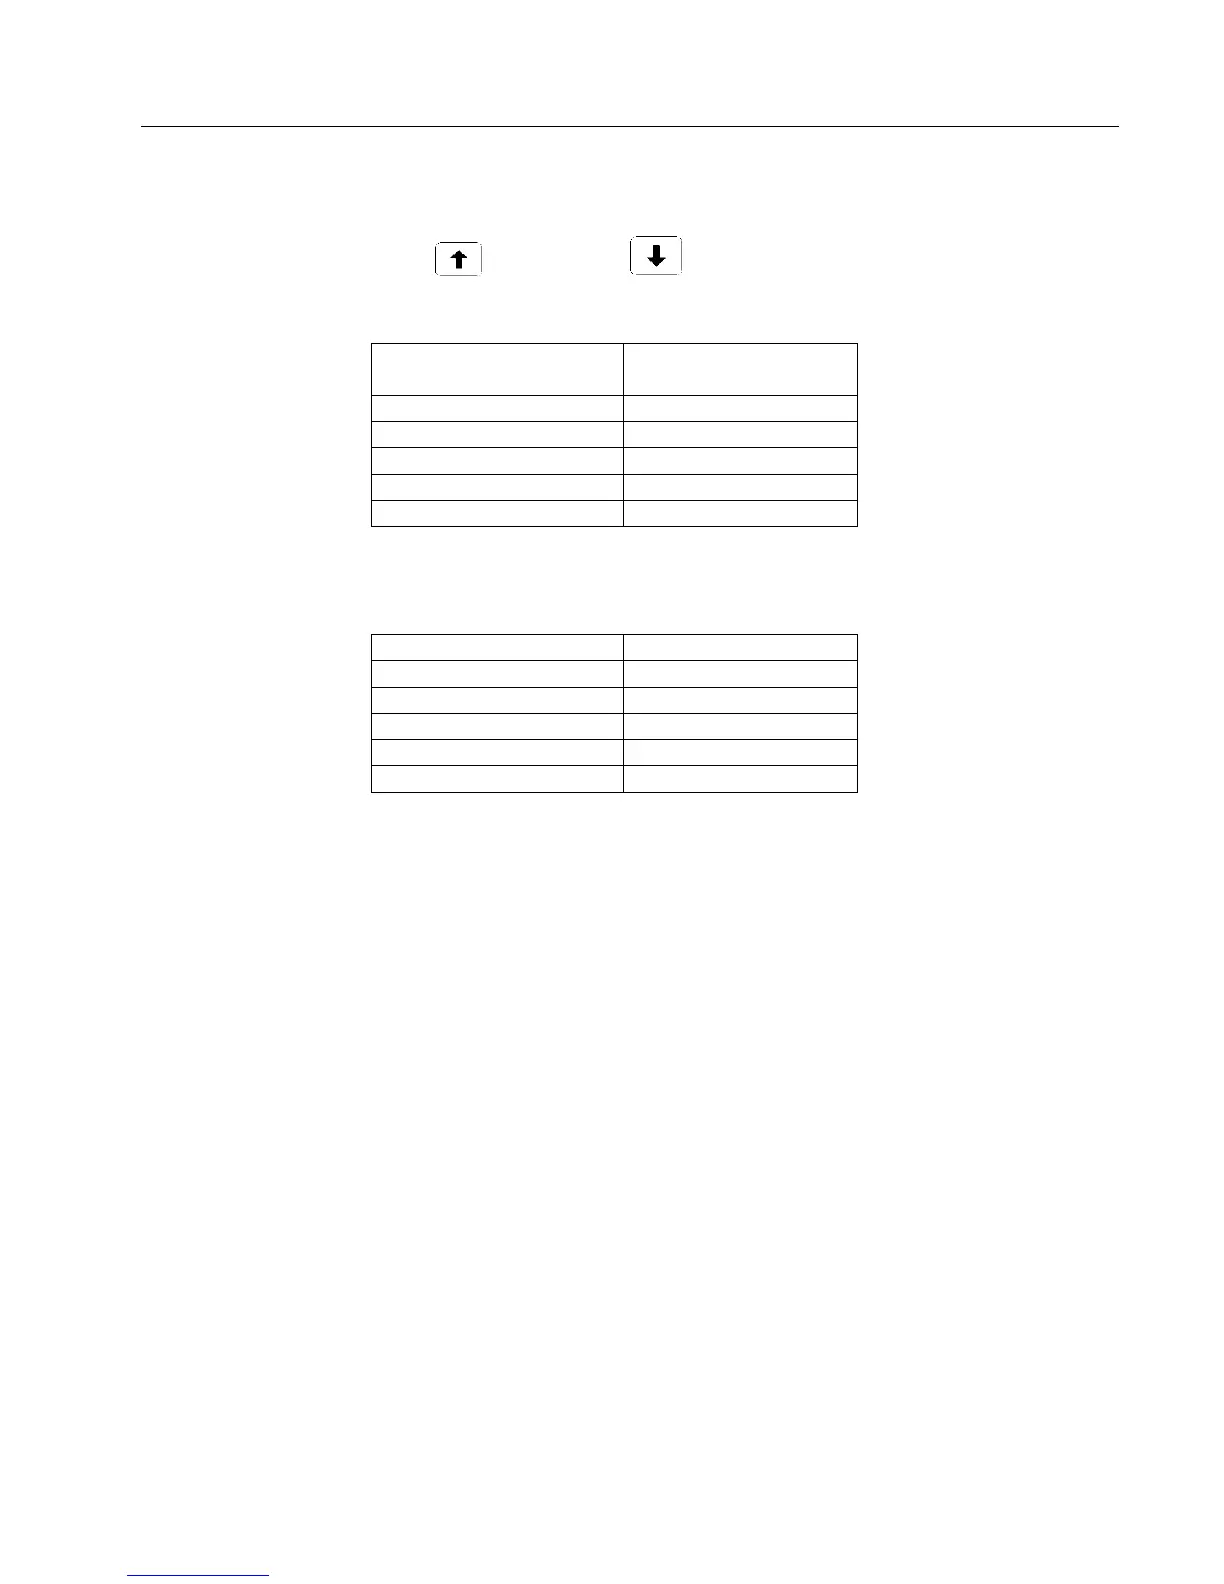
Numeric data is displayed during the measurements. The different screens can be accessed by
pressing the arrow keys, to move up and to move down:
Starting Screen:
GRAPH MODE
The data display can be switched between graphic mode and alpha/numeric mode by pressing “G”
(shift, 3). The upper 1/8th of the graph will be erased when switching between modes (a memory
limitation with the current hardware). It is best used for large sample data.
With the use of the CI-510LA (CI-301LA), the response curve of photosynthesis vs. light can be seen
by pressing “L” when measuring photosynthesis (that is shift, shift, shift 4). The CI-340 will ask for
the number of steps for light response and then will direct the CI-510LA to increase the light intensity
from very low to very high in that number of steps. Make sure the intensity knob on the CI-510LA is
turned all the way counterclockwise (see Appendix B). Only the CI-510LA ordered with CI-340 can
be automatically controlled by the CI-340 to generate the light response curve.
The response curve of photosynthesis vs. CO
2
can be seen by pressing “C” (shift, shift, shift, 1) when
measuring photosynthesis. The CI-340 will then ask what step size to make the CO
2
adjustments, and
then it will direct the CI-510AD (CI-301AD) to slowly step from the lower limit to the upper limit,