134
Chapter 5
Troubleshooting
5
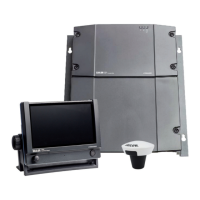
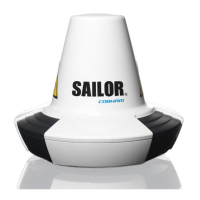
C/No:
• The C/No plot show the C/No, ’signal to noise’, over time.
• The normal C/No is for the regional beam around 60dbhz,
but the C/No will vary depending of the terminal class and the
beam type.
• To the left a C/No has been monitored. Between 9.17 and 9.18
the terminal was idling and no PS or CS connecton was up.
• At 9.18 a data connection was started, and the C/No raised
from 60 to 70 dbhz, once the beam type changet from regional
beam to spot beam (spot id 8 to spot id 100. Spot 8 is the
regional beam covering Denmark and spot id 100 is the narrow
beam covering Denmark)
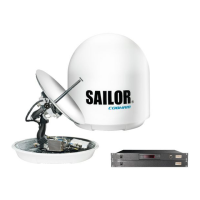
Rates:
• The rate plot show the data throughput
• Red is receiver data kbps (RxRate)
• Blue is transmittet data kbps (TxRate)
Explanation Button
Reset X and Y ranges to their
original values
Rescaletheplottottodata
Center current X values
Figure 5-42
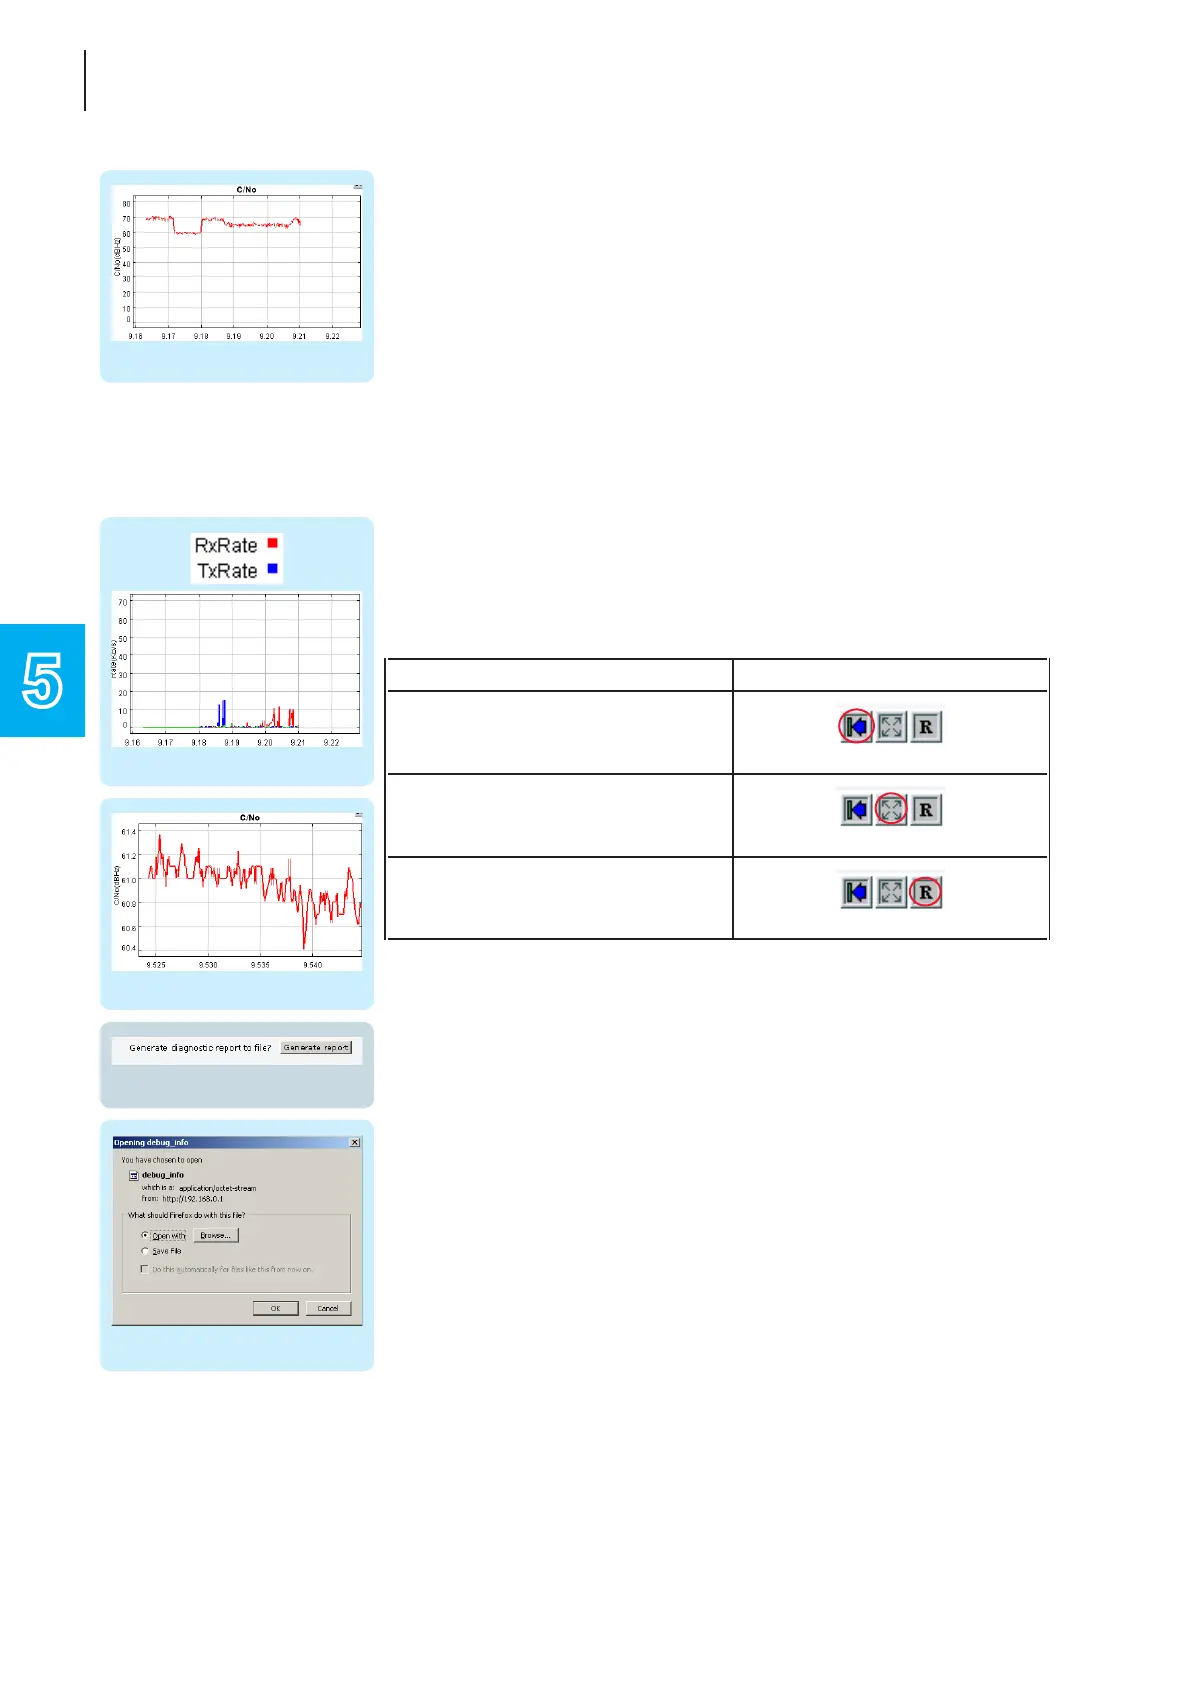
5.6Diagnosticreport:’Reportinale’
To view the diagnostic report click the ’Generate report’.
Open the diagnostic report using for example ’wordpad MFC’. The
Diagnosticreportisaverybigtextelcontainingalotofsystem
information. (250 pages of txt).
One important thing to know is that there is very little history in the
log. All the system information is a ’snapshot’ of now and some
minutes back. (A few traces will hold history. Like the errorlog).
Therefor it is important that the report is generated right after a
problem has occured.
It is also important to know that the diagnostic report, and a detailed
fault description are not mutually exclusive. In other words: You
will have to know what to look for.
Figure 5-43
Figure 5-44
Figure 5-45
Figure 5-46
Figure 5-47

 Loading...