DISPLAy MODES
MT6210 A2L MITIGATION CONTROLDAIKIN APPLIED
10
Display Modes
Accessing Display Modes
The MODE button allows the user to access sensor/network
information and enter a manual test mode while the control is
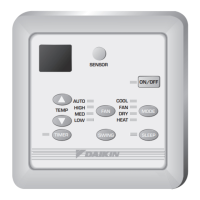
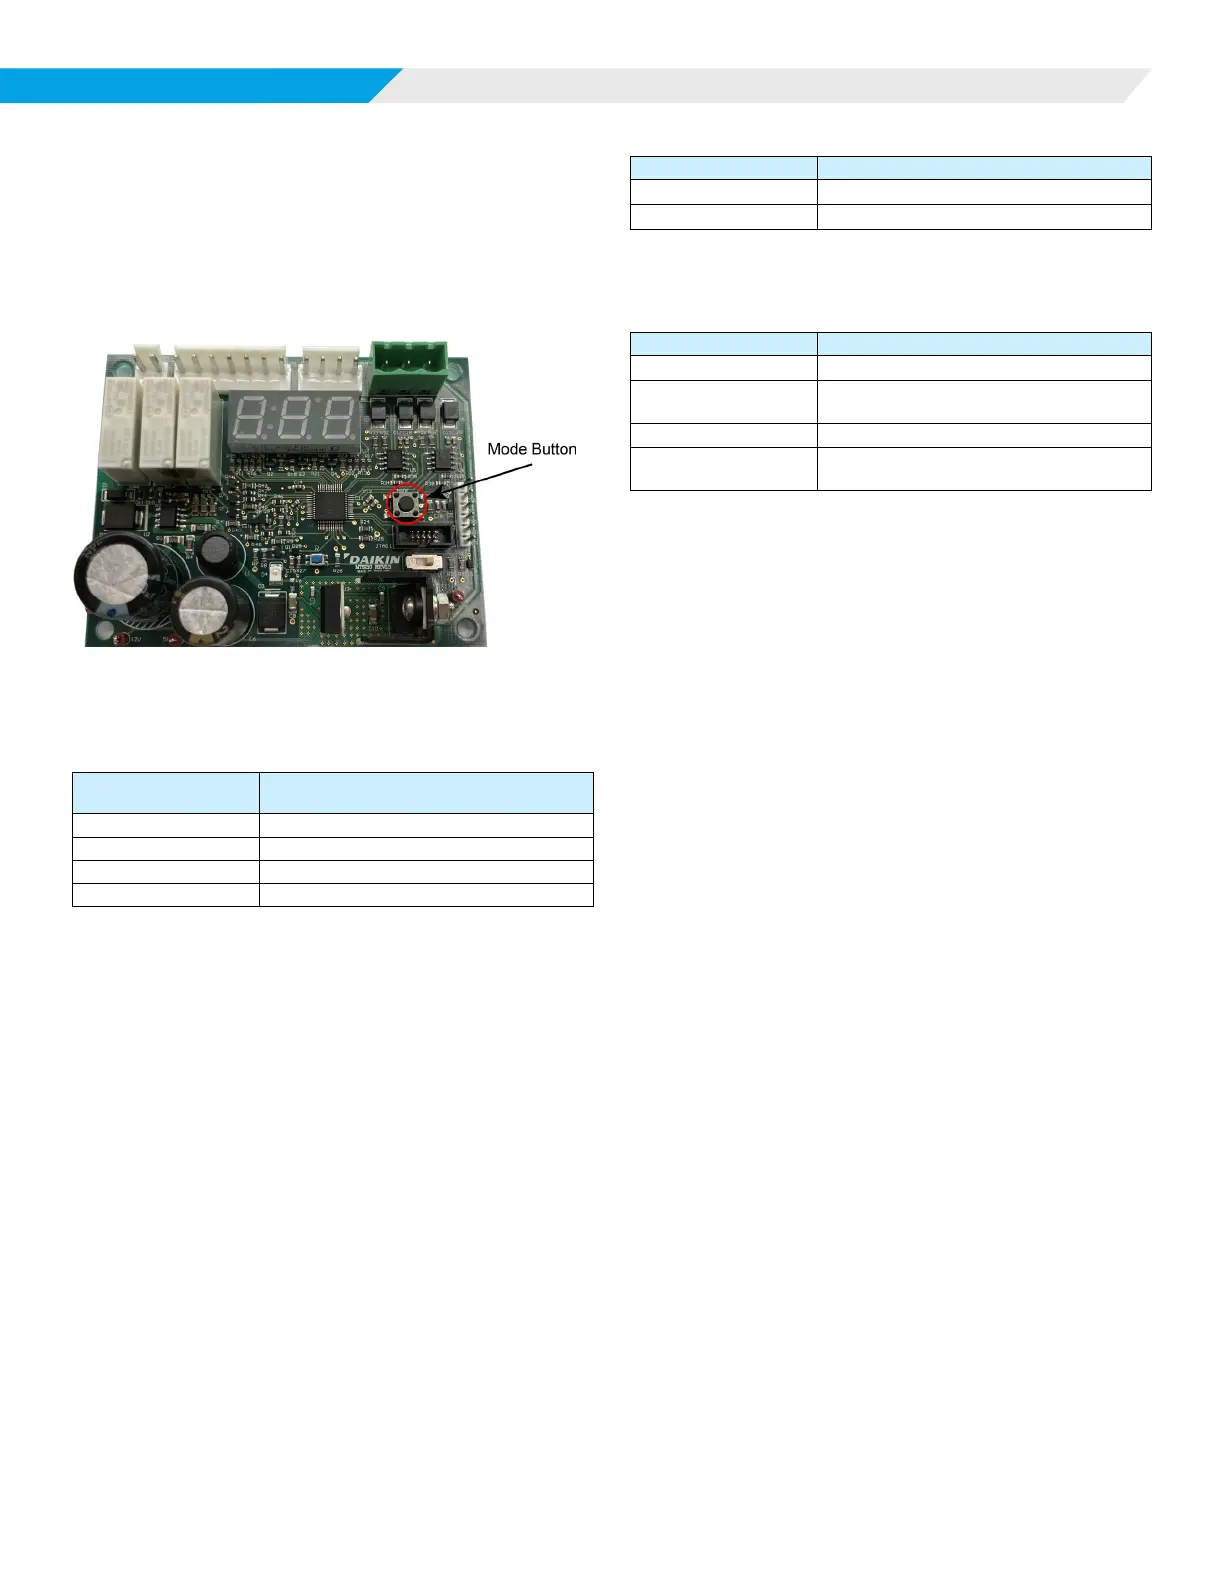
running. The MODE button is located as shown in Figure 3.
Figure 3: Mode Button Location
When the Mode button is pressed for the prescribed timing, the
LED display will enter the associated mode as shown in Table 8.
Table 8: Display Modes
Mode Button Press
Duration (t)
Display Mode
t < 2 seconds Error History
2 < t < 5 seconds Sensor Status
5 < t < 10 seconds Manual Test Mode
10 < t < 15 seconds GID Display Mode
NOTE: Display Modes will not be available during an active
alarm event.
Error History Mode
Pressing and releasing the MODE button for less than 2 seconds
places the display into Error History Mode. During this time
interval, the display shows HST.
Function
The last ten (10) errors will be displayed sequentially beginning
with the most recent.
Display
1. Each entry will be preceded by the order number in the
history buer.
2. Alarms are displayed as a single entry indicating the sensor
that exceeded the %LFL threshold.
Table 9: Display Example
LED Display LED Display Interpretation
1 1st History Record
A02 Alarm on Sensor 2
3. Faults are displayed as a double entry indicating the sensor
involved and the type of fault incurred.
Table 10: Display Example
LED Display LED Display Interpretation
2
2nd History Record
F01
FLT
Self-test failure on Sensor 1
3
3rd History Record
F04
LOC
Communication error on Sensor 4
4. The display returns to normal operation after the last data
is shown.
Sensor Status Mode
Pressing and releasing the MODE button for more than 2
seconds but less than 5 seconds places the display into Sensor
Status Mode. During this time interval, the display shows STS.
Function
The user can scroll through status information for each sensor
in the system, including the current %LFL and any active Fault
states. Alarm states are indicated by the %LFL level exceeding
the alarm threshold (typically 15%).
Display
1. The user scrolls through the information by subsequent
button presses after entering the Sensor Status Mode.
2. The display shows the sensor number, %LFL, and active
fault (if any).
3. The display will scroll through all eight sensors (1-8) and
show LOC for any sensors not communicating or not
installed.
4. In the case of a system with four sensors, where three
sensors are operating normally and sensor 2 has an
internal fault, the display responds as shown in Table 11 on
page 11.