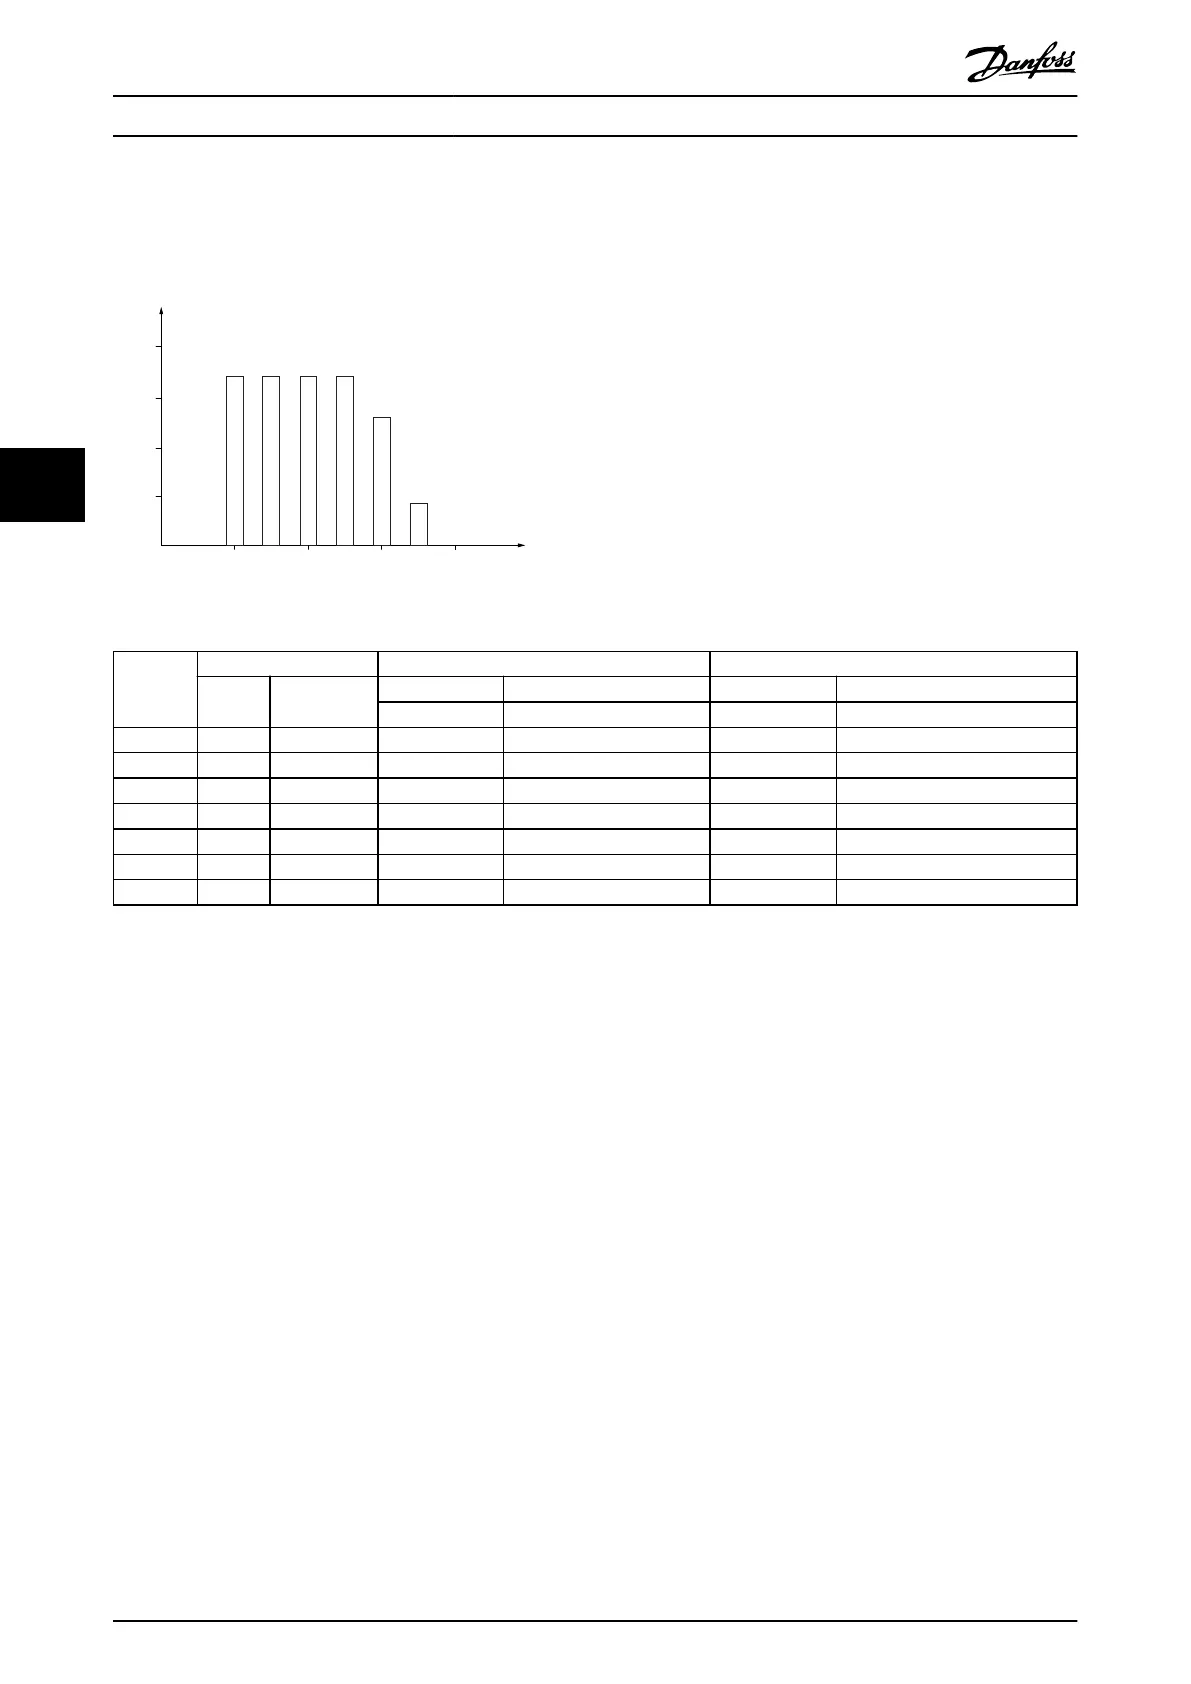
Example with varying ow over 1 year
Illustration 5.11 is based on pump characteristics obtained from a pump datasheet. The result obtained shows energy
savings more than 50% at the given ow distribution over a year. The payback period depends on the price per kWh and
the price of the drive. In this example, it is less than a year when compared with valves and constant speed.
500
[h]
t
1000
1500
2000
200100 300
[m
3
/h]
400
Q
175HA210.11
Illustration 5.11 Flow Distribution Over 1 Year
m
3
/h
Distribution Valve regulation Drive control
% Hours Power Consumption Power Consumption
A
1
-B
1
kWh A
1
-C
1
kWh
350 5 438 42.5 18615 42.5 18615
300 15 1314 38.5 50589 29.0 38106
250 20 1752 35.0 61320 18.5 32412
200 20 1752 31.5 55188 11.5 20148
150 20 1752 28.0 49056 6.5 11388
100 20 1752 23.0 40296 3.5 6132
Σ 100 8760 – 275064 – 26801
Table 5.2 Energy Savings Calculation
Product Features
VLT
®
HVAC Drive FC 102
28 Danfoss A/S © 11/2017 All rights reserved. MG16C302
55
 Loading...