Page 13 of 20 2/3/2010 @ 9:00 AM
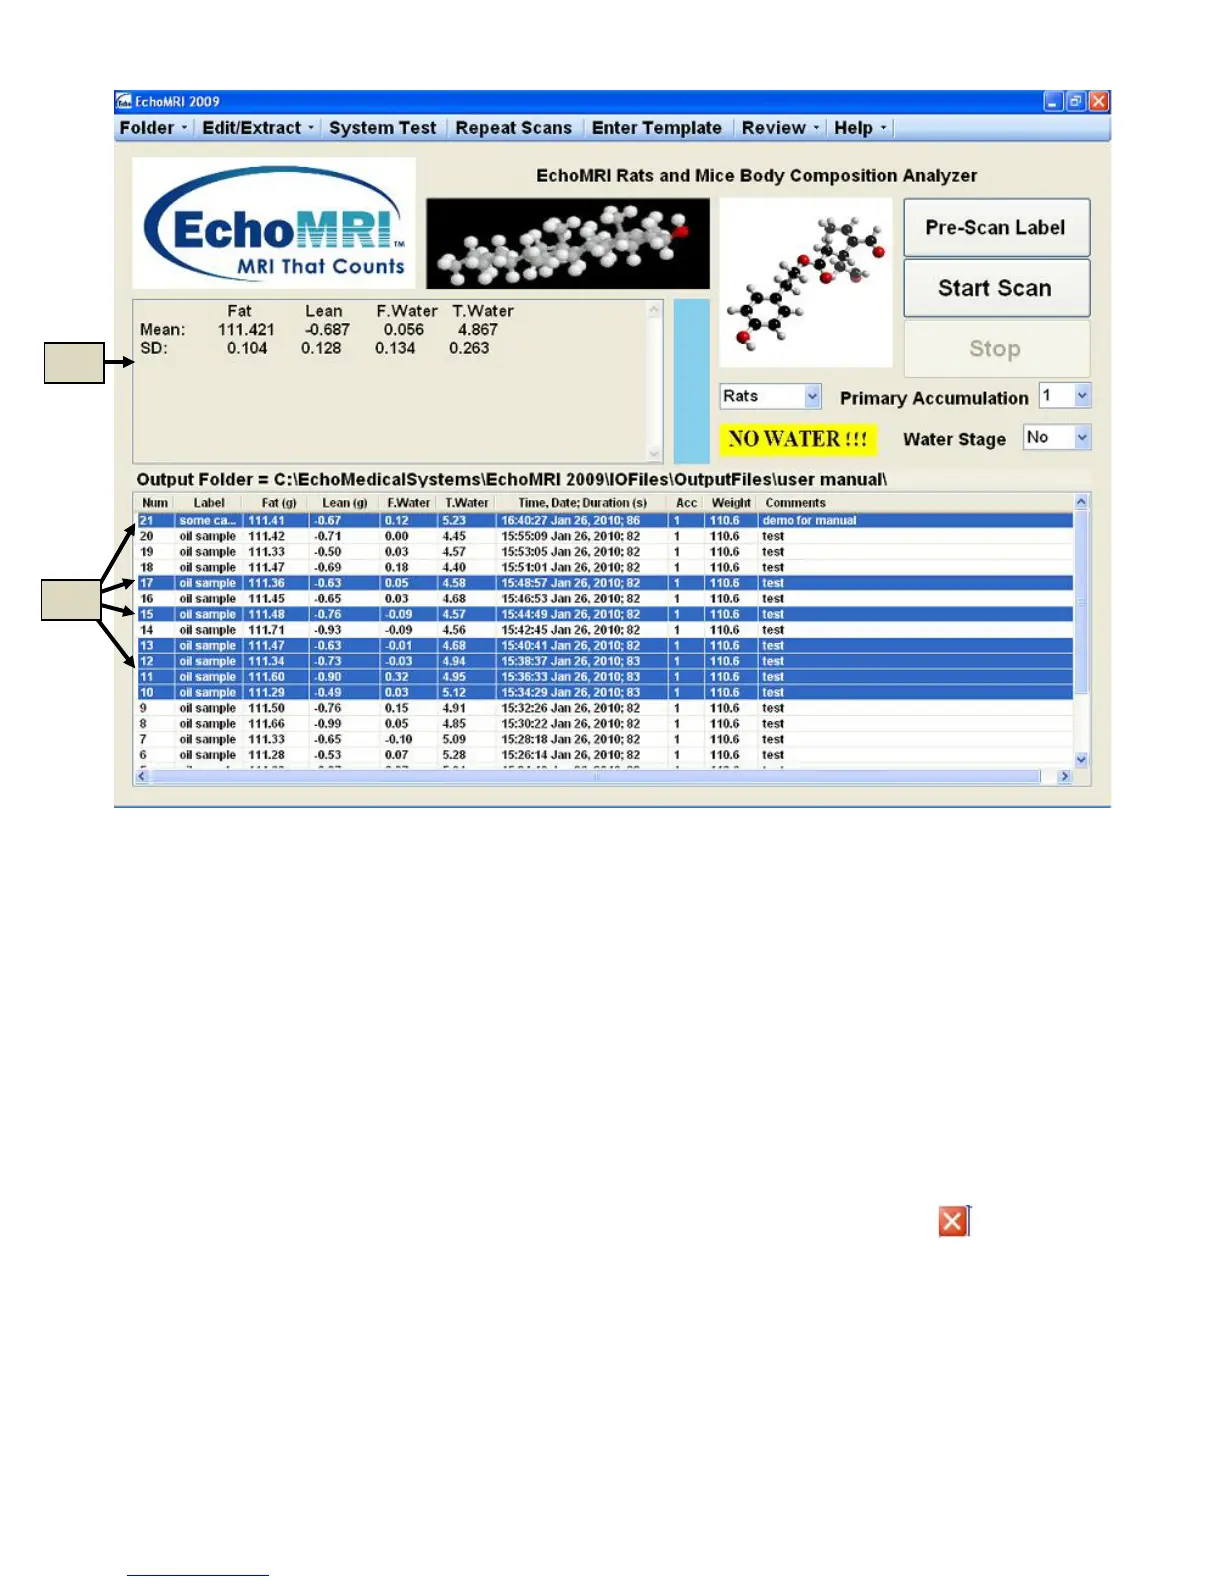
Figure 6.1
Plot History: F7 or Review → Plot Selected
Plots of either all the records or only of selected records from the current Output Directory (6a in Figure 6.1) are
displayed in a separate page (Figure 6.2). Use “Ctrl + A” if you want to select all the records. After the plots
pop up, button “Toggle Full/Selected” (6f in Figure 6.2) switches between Plot-All and Plot-Selected options. It
is also possible to choose which four of the available columns of the Measured Results List you want to plot, by
selecting their titles in the list on the left (6c in Figure 6.2) and then pressing the Re-Plot button (6e in Figure
6.2).
The titles of the plot display the mean, the standard deviation and a de-trended standard deviation (DSD)
defined, for a set {X
i
, i = 1,…,n}, as (1/√2) times the standard deviation of set {(X
i
- X
i-1
), i = 2,…,n}.
To exit Plot History press either the Esc button on the keyboard or the white-on-red cross in the upper right
corner.