Dynamic Processing 191
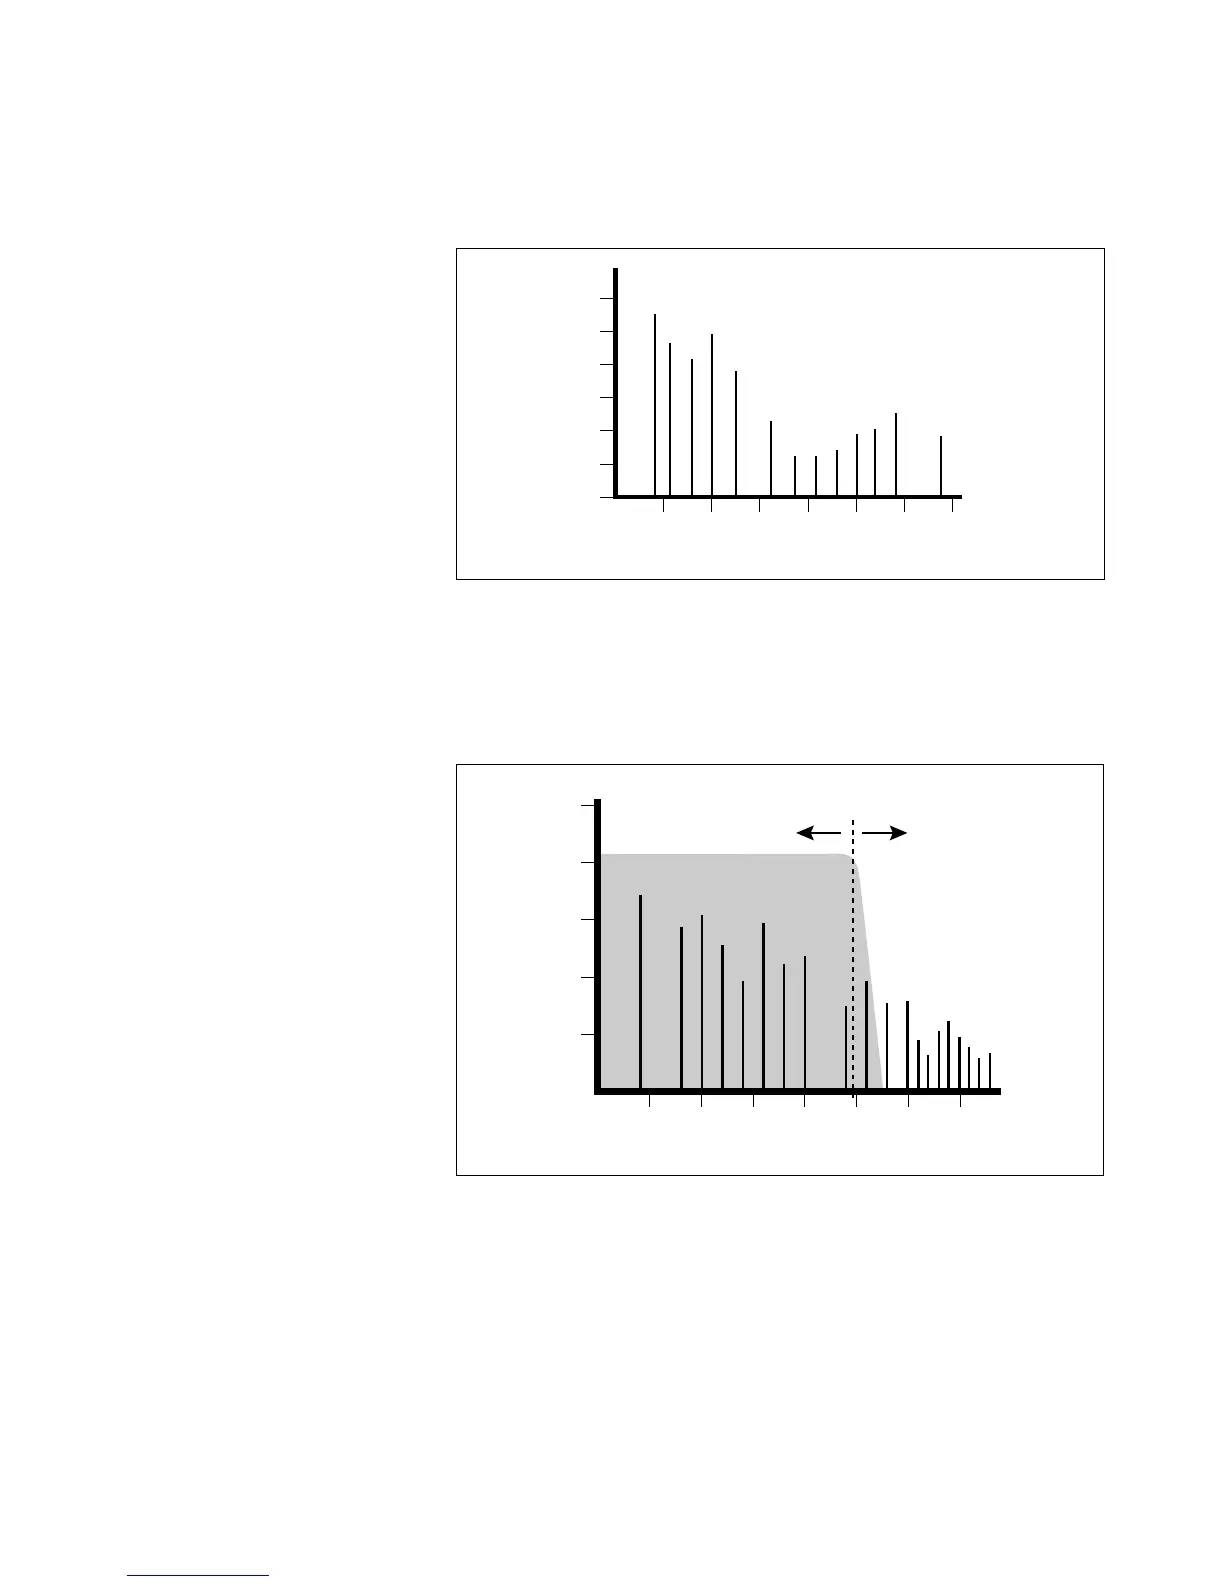
One way to represent complex waveforms is to use a chart with fre-
quency on one axis and amplitude on the other. Each vertical line of the
chart represents one sine wave at a specific amplitude.
40 80 160 360 720 1440 2880
Frequency
Amplitude
Each vertical line of the chart represents one sine wave at a specific amplitude.
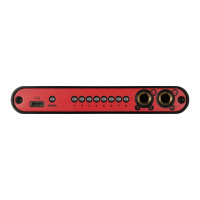
Most sounds are complex waves containing many sine waves of various
amplitudes and frequencies. A filter is a device which allows us to
remove certain components of a sound depending on its frequency.
For example, a Low Pass Filter, lets only the low frequencies pass and
removes only the high frequencies.
20
40
60
80
100
40 80 160 360 720 14402880
Frequency
...
Amplitude
Output of Filter
Cutoff Frequency
The point at which the frequencies are rejected is called the Cutoff
Frequency (or Fc for short). A filter that lets the frequencies above the
Fc pass is called a High Pass filter. Using a filter, we now have a way to
control the harmonic content of a sampled sound. As it turns out, a low
pass filter can simulate the response of many natural sounds.
For example, when a piano string is struck by its hammer, there are
initially a lot of high frequencies present. If the same note is played
softer, there will be fewer of the high frequencies generated by the string.
We can simulate this effect by routing the velocity of the keyboard to
control the amount of high frequencies that the low pass filter lets
through. The result is expressive, natural control over the sound.