0000137242 Rev. 7.1 10
2
nd
Screen:
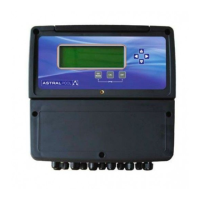
The second screen (accessible by pressing the right arrow) is simplified compared to the previous screen,
containing less information but more easily to read and of immediate access.
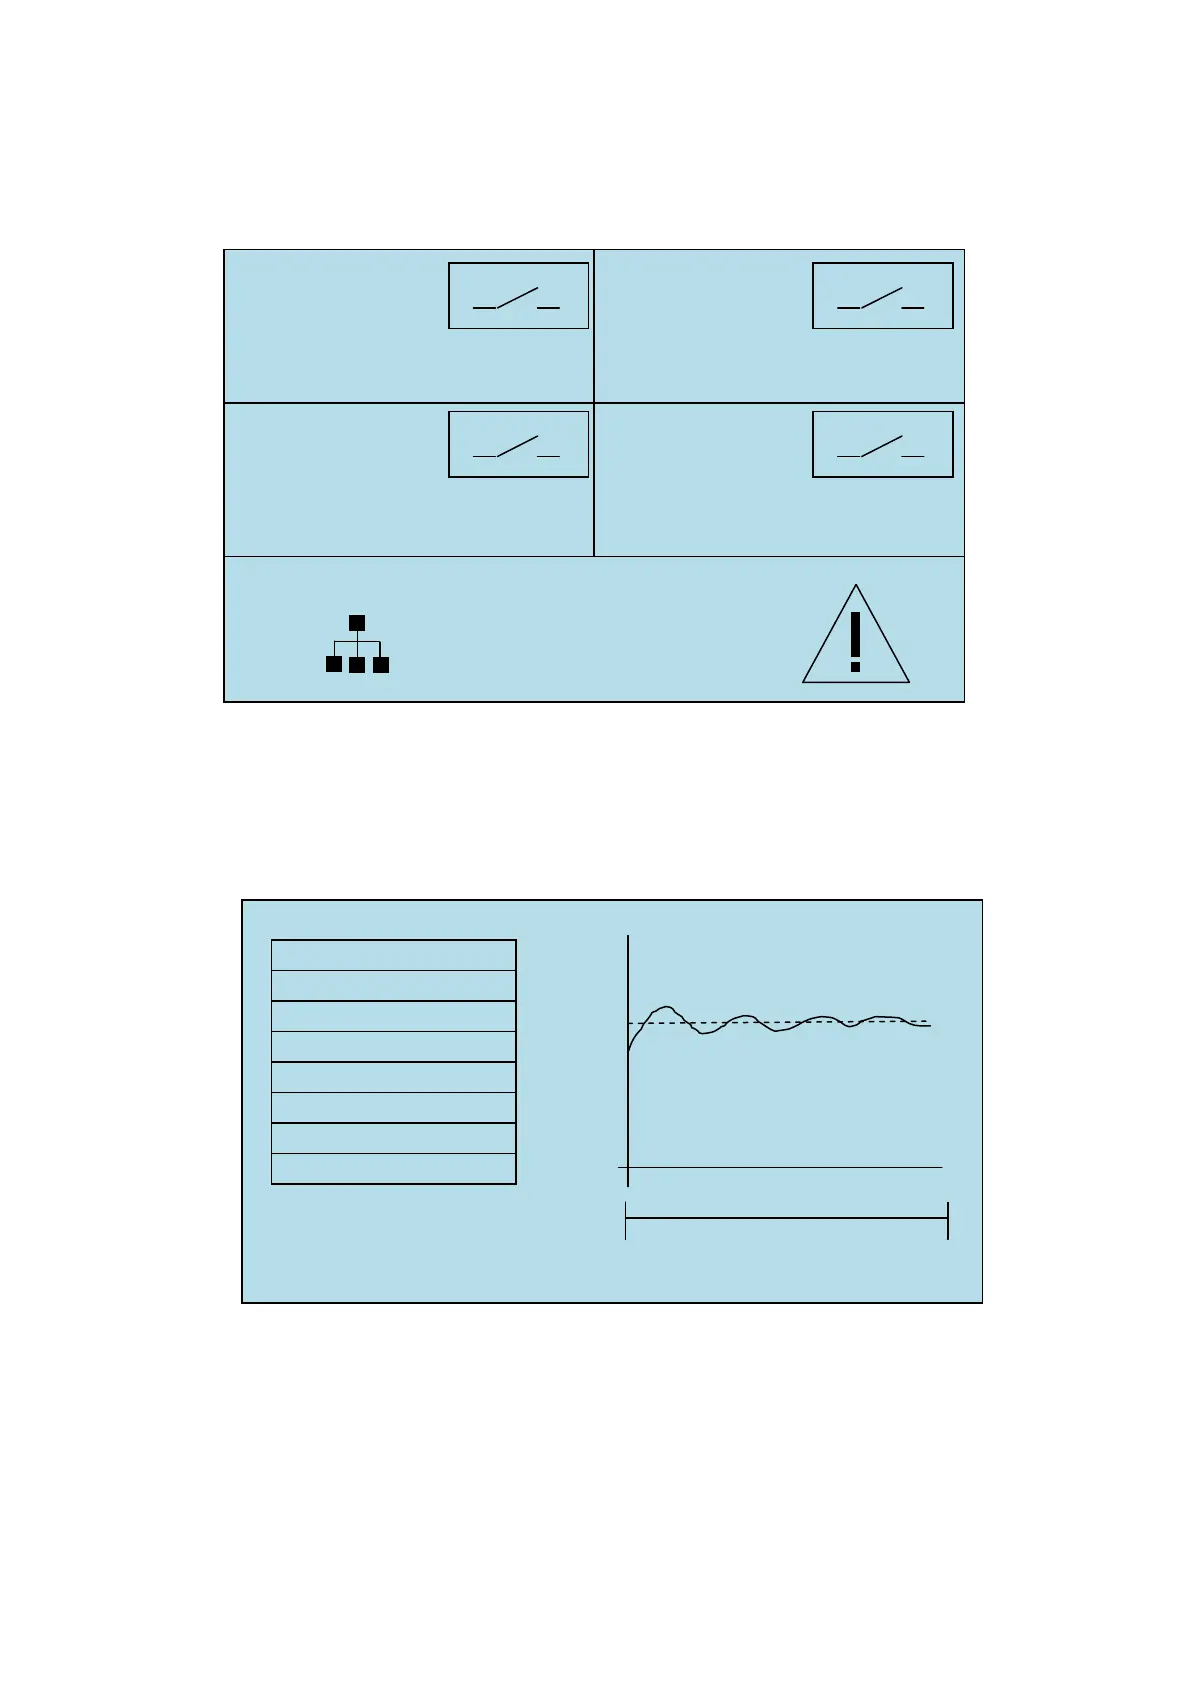
3
rd
Screen:
In this screen is displayed a graphical representation of the statistical data about individual measures, the set-point
value, the statistical data acquisition mode (Circular or Single scan), the time period over which the data for the 120
samples, available for each measure, have been acquired and the value of the actual measure.
You can scroll the graphs for all measures by using the up and down arrow keys!
The graph is updated automatically as soon as a new statistical value is acquired.
SP1: 7.23pH
6.90
pH
SP2: 1.19ppm
1.50
ppm
SP3: +700mV
+600
mV
SP4: 24°C
25.3
°C
MTC
Flow ON >>HOLD<<
>>OFA<<
15:33
SP1
Min
MEASURE TREND(PH)
1H