d. Rotate the
RECORDER OUTPUT
level control
counter-clockwise,
observir^ that
the RECORDER
OUTPUT voltage
decreases
to zero volts.
e. Adjust the
RECORDER OUTPUT level
control for
an indication
of 0. 2 volts on the dc
differential
voltmeter.
4-36. When the results of these checks agree with the
information given, the Recorder Output Option circuitry
is functioning properly and
the
test
equipment
can be
disconnected from the instrument.
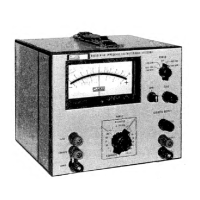
4-37. AC CONVERTER CHECKS
f. Place the
Model
893
Readout
dials to
.
00010,
ob-
serving that the
RECORDER OUTPUT
voltage in-
dicated on the
dc differential
voltmeter is
-0.02
volts dc.
BASE OF
Q1
or Q2
1
7^
iI
1m 1
i1
1 1
1 1
i
m 11 11HH
1
h
[ 1
.i MSEC
u
FULL SCALE
INPUT EMITTER
Q
1 or
Q2
EMITTER Q3 or
Q4
BASE Q3 or
Q4
Figure 4-8.
RECORDER OUTPUT WAVEFORMS
4-38.
The AC Converter Checks require an ac calibra-
tion source,
an oscilloscope, and
a dc differential volt-
meter. Circuit waveforms are illustrated in Figure
4-10.
To perform the checks, apply ac power to the
instrument
and proceed as follows:
a.
Place the
Model 893
controls
as
follows:
POWER
RANGE
NULL
SENS
MODE
Readout dials
ON/LINE
OPR
1
.001
AC
1
.
000 00
b.
Connect the dc differential
voltmeter input to A7
terminal 7 and its common lead to A
7 terminals
The voltmeter should
indicate 12 ±0. 2 volts
dc.
c. Connect the voltmeter
input
to
the junction of
R41
and CR5, observing that the voltmeter indicates
10
±0.5 volts dc.
d. Connect the voltmeter input to A7 terminal
6,
ob-
serving that the voltmeter indicates
-12
±0. 2 volts dc.
e. Connect
the
voltmeter
iiput
to the junction of R42 and
CR6,
(^serving that the voltmeter indicates -10±0.
5
volt dc.
Disconnect the voltmeter upon
completion
of this step.
f.
Apply
a calibrated one
volt
ac signal at 400 Hz
between the
LO
and HI INPUT terminals of the
instrument.
g.
Connect the oscilloscope input to the emitter of A7Q6
and the ground
lead
to A7 terminal
5,
Hie signal
o!>
served on
the oscilloscope CRT
should be
identical
to tlie full scale
AK^
emitter waveform illustrated
in Figure
4-10.
E necessary, adjust A7R35 to oWain
a
meter indication
of 0±0.5 major divisions.
h. Apply
a
calibrated 0. 1 volt ac signal
at
400
Hz to
the
n^UT
of the Model
893,
observing that the
wave-
form displayed on the oscilloscope CRT
is identical
to the A7Q6 l/lO scale input
waveform illustrated
in Figure
4-10.
i. Perform the RANGE checks described
in Figure
4-9
at
400 Hz, observing that the
specified results are
obtained.
If necessary, adjust the associated adjust-
ment to obtain the specified
meter
indication.
j.
Perform the AC Converter RANGE
checks described
in Figure
4-9,
disregarding the
adjustmeit and meter
indicatiorB, at frequencies of
20
Hz, 20 kHz,
50 kHz,
and 100 kHz. TTie waveforms observed
on the
oscil-
losccpe CRT
should be consistant with the peak-to-
peak levels of
A7Q6
illustrated in Figure 4-10.
9/22/71
4-11
893A