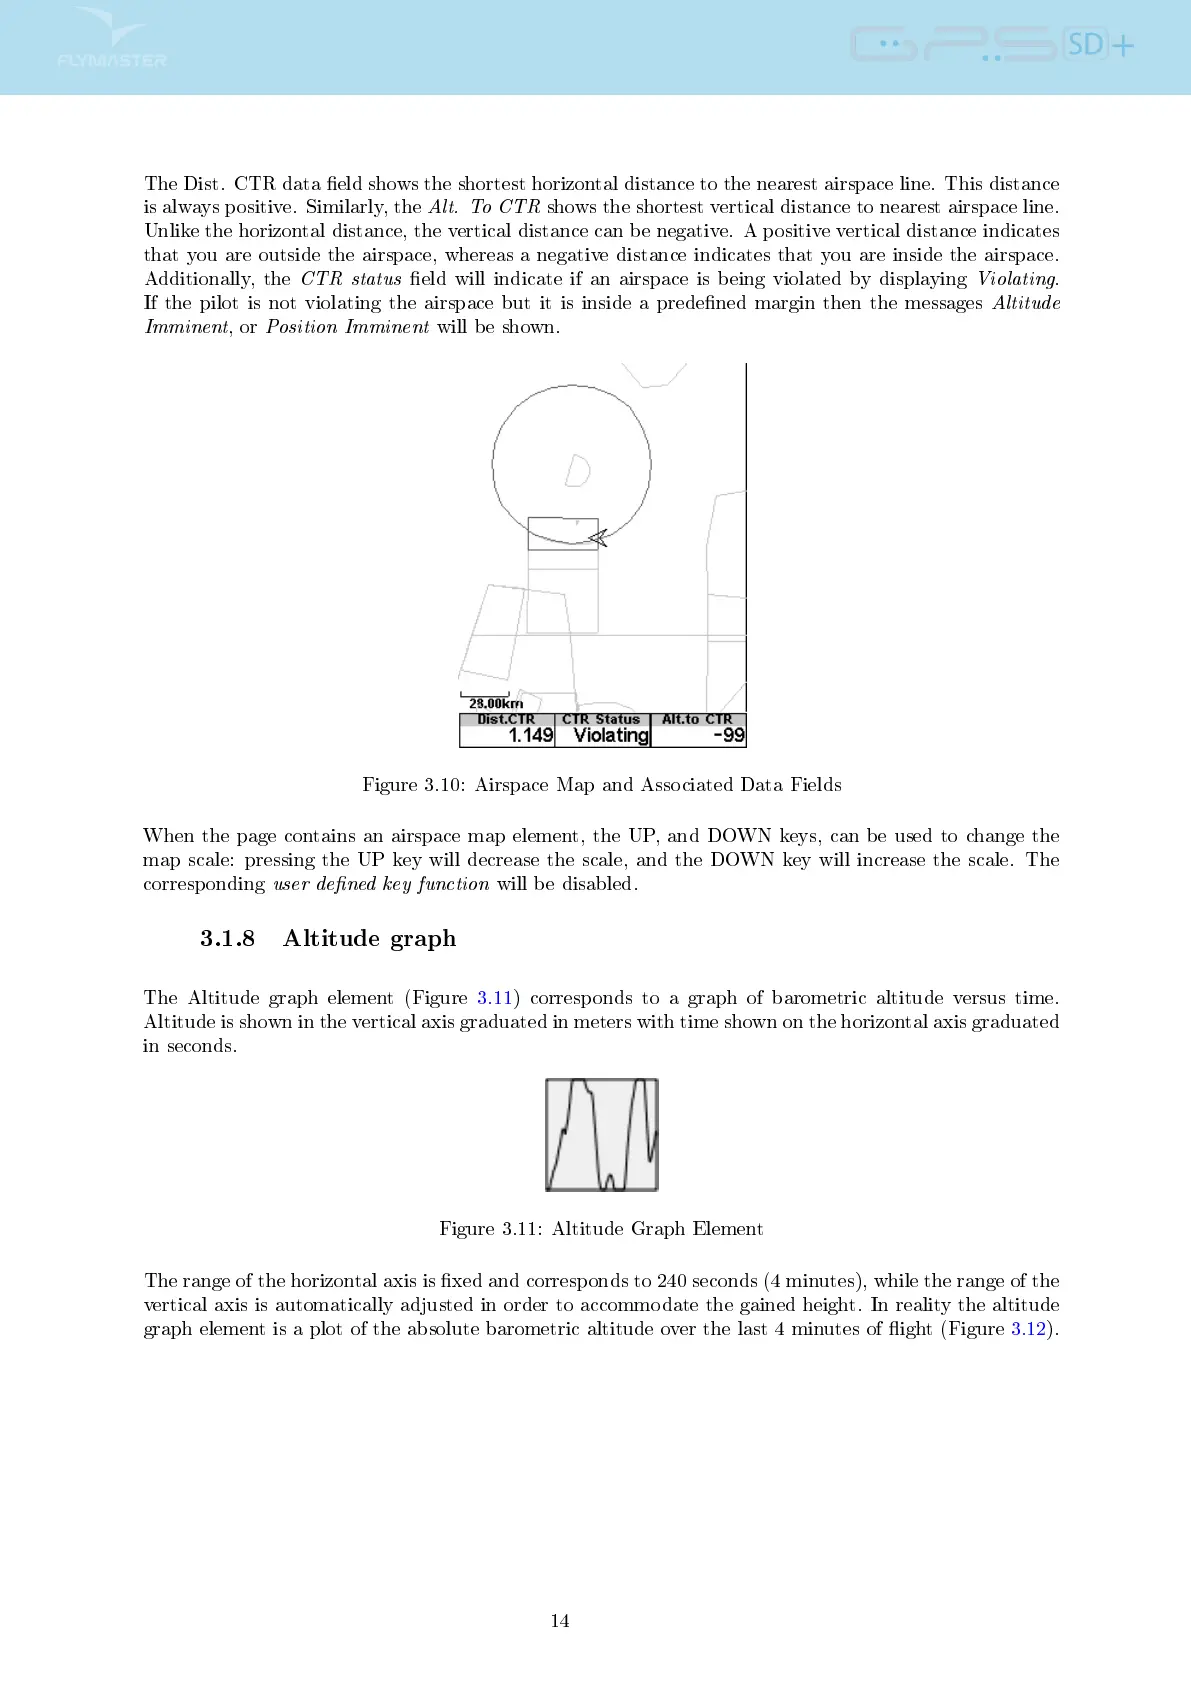
The Dist. CTR data eld shows the shortest horizontal distance to the nearest airspace line. This distance
is always positive. Similarly, the
Alt. To CTR
shows the shortest vertical distance to nearest airspace line.
Unlike the horizontal distance, the vertical distance can be negative. A positive vertical distance indicates
that you are outside the airspace, whereas a negative distance indicates that you are inside the airspace.
Additionally, the
CTR status
eld will indicate if an airspace is being violated by displaying
Violating
.
If the pilot is not violating the airspace but it is inside a predened margin then the messages
Altitude
Imminent
, or
Position Imminent
will be shown.
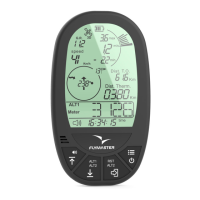
Figure 3.10: Airspace Map and Associated Data Fields
When the page contains an airspace map element, the UP, and DOWN keys, can be used to change the
map scale: pressing the UP key will decrease the scale, and the DOWN key will increase the scale. The
corresponding
user dened key function
will be disabled.
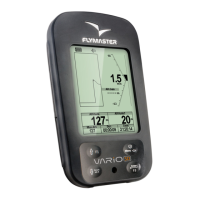
3.1.8 Altitude graph
The Altitude graph element (Figure 3.11) corresponds to a graph of barometric altitude versus time.
Altitude is shown in the vertical axis graduated in meters with time shown on the horizontal axis graduated
in seconds.
Figure 3.11: Altitude Graph Element
The range of the horizontal axis is xed and corresponds to 240 seconds (4 minutes), while the range of the
vertical axis is automatically adjusted in order to accommodate the gained height. In reality the altitude
graph element is a plot of the absolute barometric altitude over the last 4 minutes of ight (Figure 3.12).
14