Configuration with the web interface
5-33
• Send interval: Select disabled, day (default) with 2-minute samples, week with
hourly samples or month with hourly samples. The report contains statistics data
for the selected intervals.
4. Click Apply.
You can also send the report at any time by clicking Send now. Use Send now to validate
the e-mail setup. See also Download of a diagnostic report or a statistics report on
page 7-2.
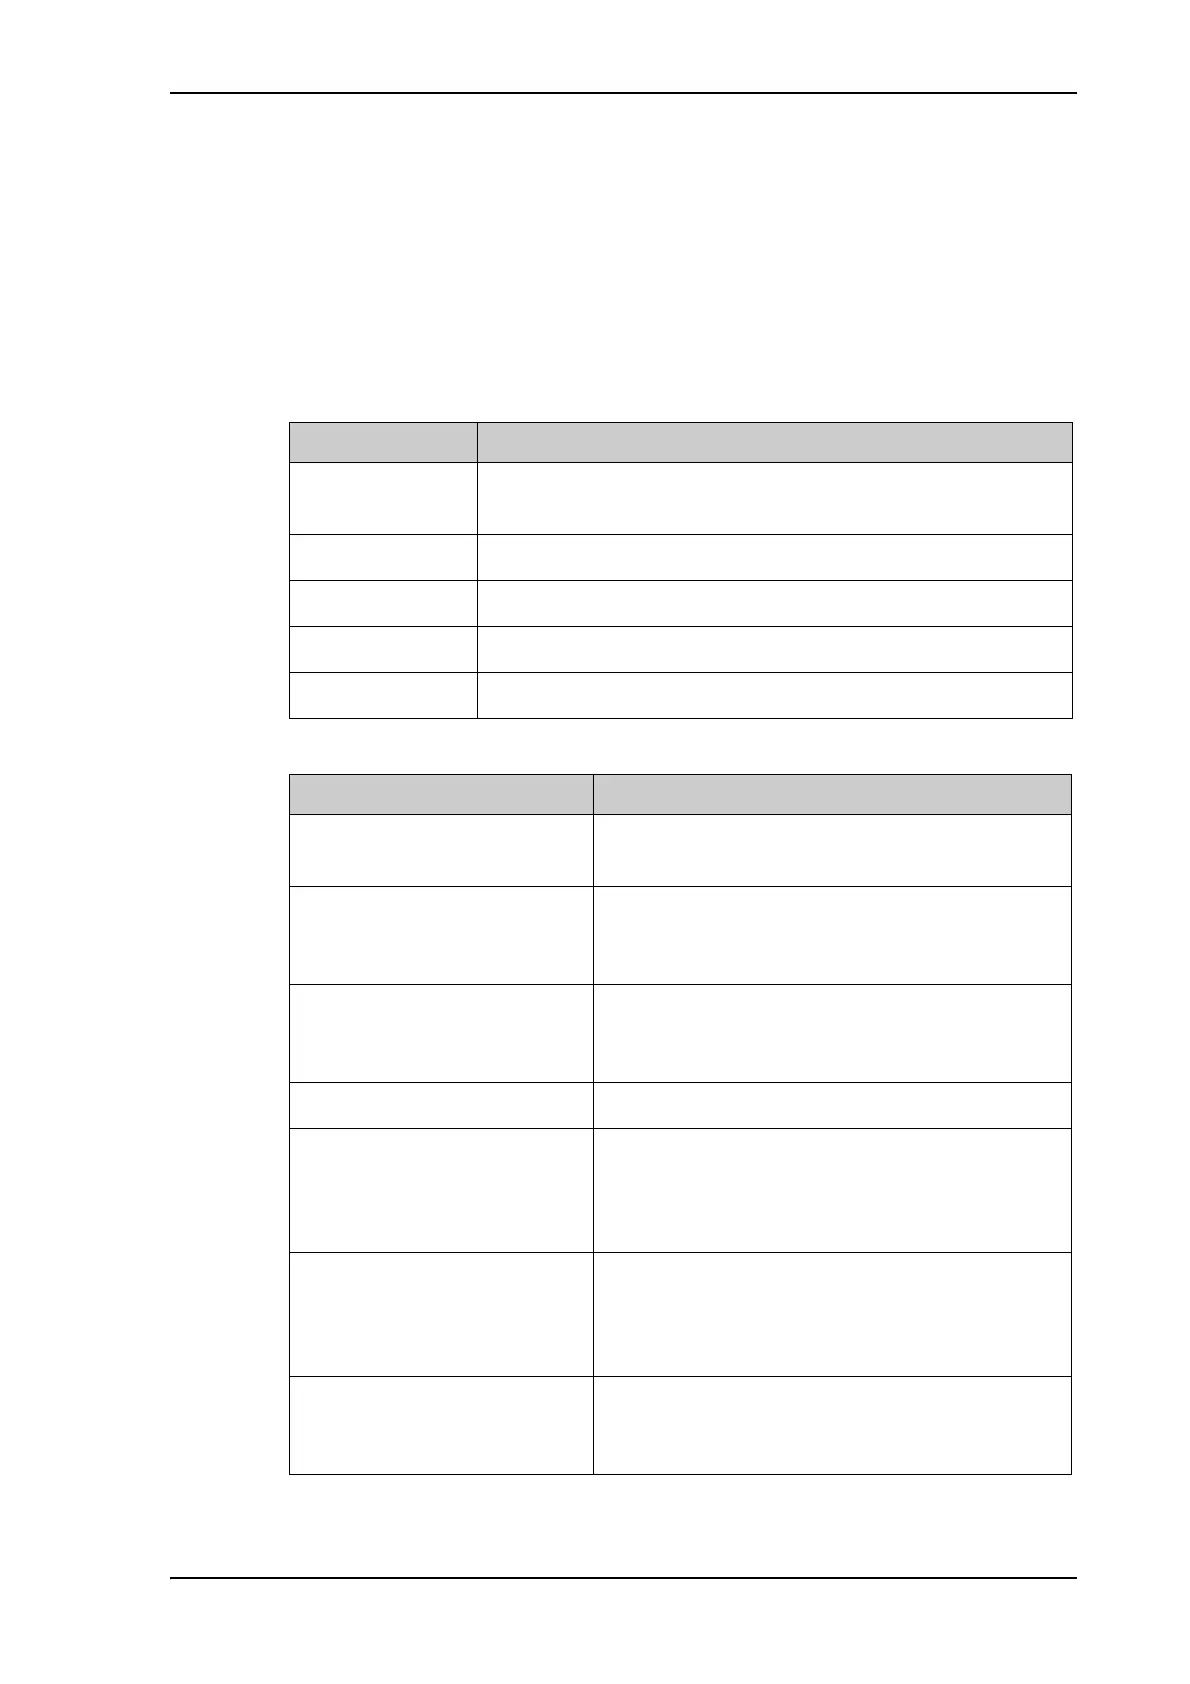
The following parameters are recorded in the statistics report:
Parameter recorded Description
Hostname Host name, entered in the web interface on the page SETTINGS
> Network.
ACU SN ACU serial number
ADU SN ADU serial number
SW ver. Software version
System FV-110
Table 5-17: Statistics report, header record
Parameter recorded Description
UTC. (s)
UTC (YYYY-MM-DD hh:mm)
UTC in seconds and date format for the data set.
RSSI.Av
RSSI.Max
RSSI.Min
Received signal strength (average, maximum and
minimum value) for the sampling interval.
POS.Lat (degree)
POS.Long (degree)
POS.Valid
Latitude value of position.
Longitude value of position.
Fix = valid position, No Fix = invalid position.
NAV.Speed (m/s) Navigation speed
Heading.Samp (degree)
Heading.Max (degree)
Heading.Min (degree)
Heading.Range (+/-degree)
Ship’s heading (sample, maximum and minimum
value, range) for the sampling interval. See Figure 5-
26: Statistics — how to read data for a range.
Antenna.Azi (degree)
Antenna.Azi Max (degree)
Antenna.Azi Min (degree)
Antenna.Azi Range (+/-degree)
Current antenna azimuth (sample, maximum and
minimum value, range) for the sampling interval.
See Figure 5-26: Statistics — how to read data for a
range.
Antenna.Ele (+/-degree)
Antenna.Ele Max (+/-degree)
Antenna.Ele Min (+/-degree)
Current antenna elevation (sample, maximum and
minimum value) for the sampling interval.
Table 5-18: Parameters recorded in a statistics report