23
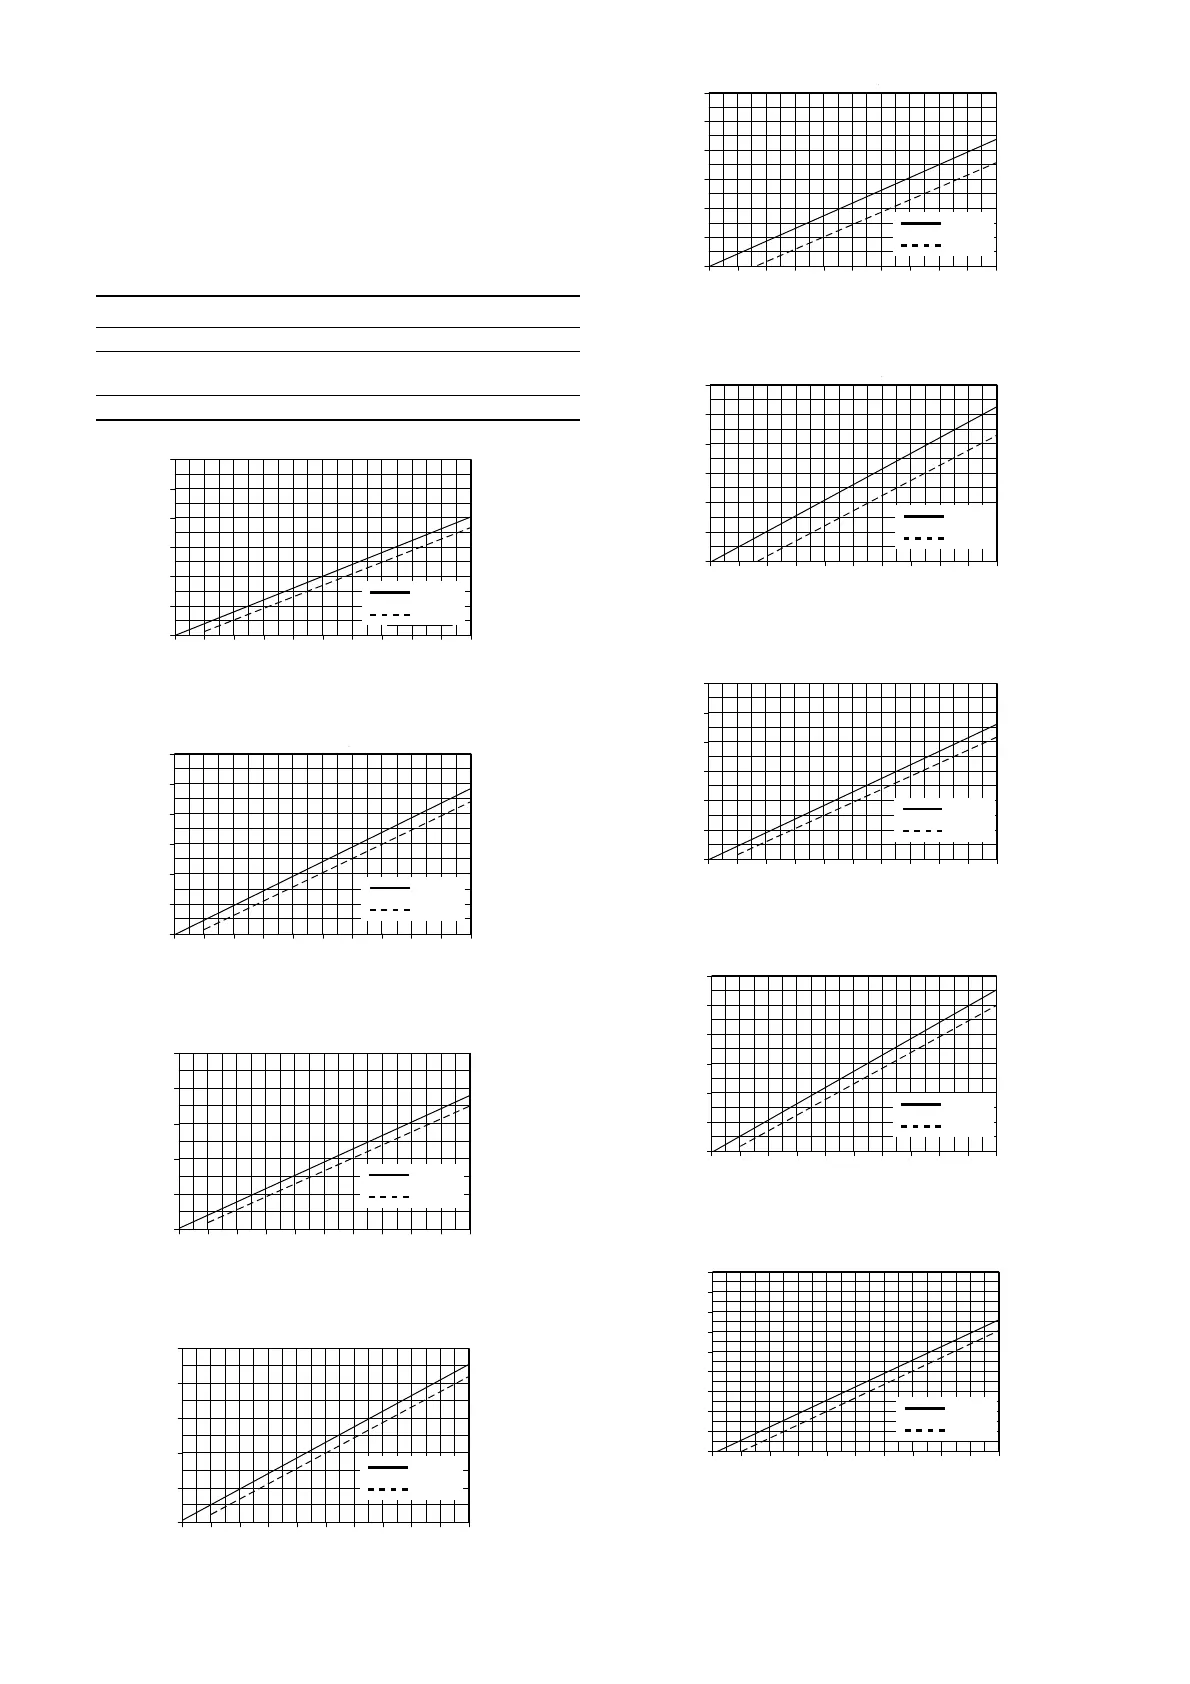
16. Dosing curves
The dosing curves on the following pages are trend curves.
They apply to:
• performance of simple pump (the flow rate is doubled for the
double pump)
• water as dosing medium
• suction line with foot valve, 0.5 m flooded suction
• zero point of pump Q
0
for specified pressure, see table below
• standard pump version.
Fig. 23 DMX 4-10 (50 Hz)
Fig. 24 DMX 4-10 (60 Hz)
Fig. 25 DMX 7-10 (50 Hz)
Fig. 26 DMX 7-10 (60 Hz)
Fig. 27 DMX 7.2-16 (50 Hz)
Fig. 28 DMX 7.2-16 (60 Hz)
Fig. 29 DMX 9-10 (50 Hz)
Fig. 30 DMX 9-10 (60 Hz)
Fig. 31 DMX 12-10 (50 Hz)
Abbreviation Description
Q Dosing flow
Q
0
Zero point of the pump
The pumps are calibrated so that Q is 0 at 3 bar.
h Stroke length
TM03 6315 4506TM03 6316 4506TM03 6317 4506TM03 6318 4506
0
1
2
3
4
5
6
0 102030405060708090100
h [%]
Q [l/h]
3bar
10bar
3 bar
10 bar
0
1
2
3
4
5
6
0 102030405060708090100
h [%]
Q [l/h]
10bar
3bar
3 bar
10 bar
0
2
4
6
8
10
0 102030405060708090100
h [%]
Q [l/h]
3bar
10bar
3 bar
10 bar
0
2
4
6
8
10
0 102030405060708090100
h [%]
Q [l/h]
10bar
3bar
3 bar
10 bar
TM03 6319 4506TM03 6320 4506TM03 6321 4506TM03 6322 4506TM03 6323 4506
0
2
4
6
8
10
12
0 102030405060708090100
h [%]
Q [l/h]
3bar
16bar
3 bar
16 bar
0
2
4
6
8
10
12
0 102030405060708090100
h [%]
Q [l/h]
16bar
3bar
3 bar
16 bar
0
2
4
6
8
10
12
0 102030405060708090100
h [%]
Q [l/h]
3bar
10bar
3 bar
10 bar
0
2
4
6
8
10
12
0 102030405060708090100
h [%]
Q [l/h]
10bar
3bar
3 bar
10 bar
0
2
4
6
8
10
12
14
16
18
0 102030405060708090100
h [%]
Q [l/h]
3bar
10bar
3 bar
10 bar
 Loading...