ADMINISTRATOR MANUAL
10
PAGE
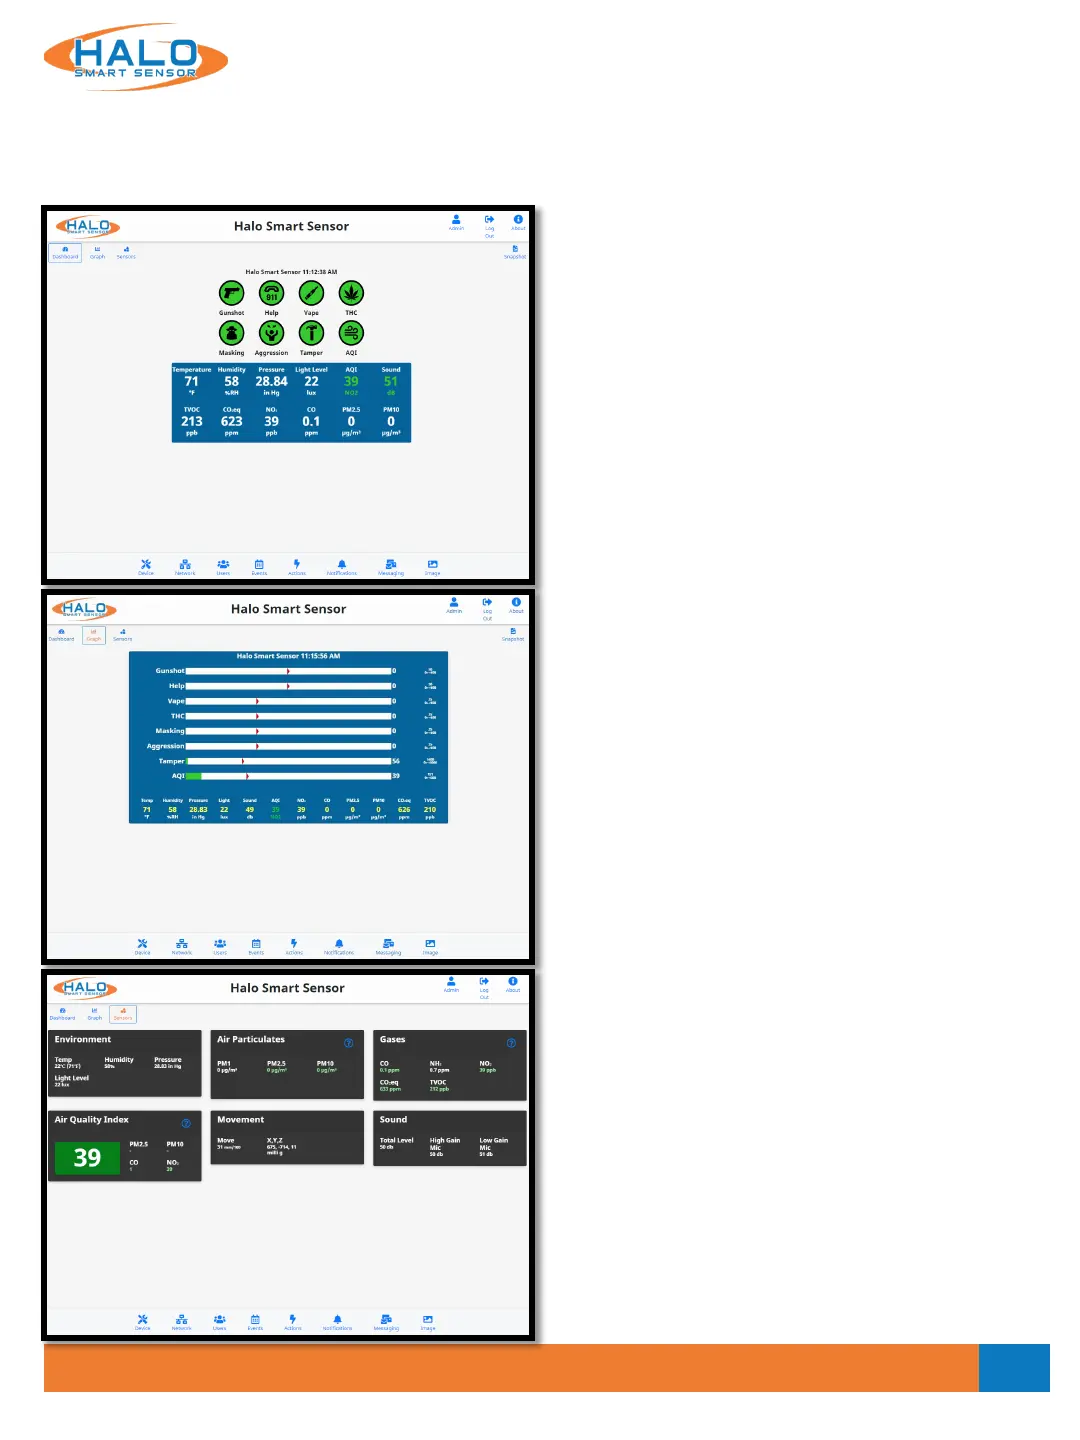
Live View
The dashboard has three different views that can be displayed. These views include Dashboard, Graph, and
Sensors.
Dashboard
Live information presented including “Normal”
and “Alert” state display through color changing
indicator icons as well as live readings of specific
signatures. This can be configured from the
"Image" button.
Graph
HALO’s graph display showing live readings of
sensors and signatures, graph readings are color
coded for signature state. This can be configured
from the "Image" button.
Sensors
The raw sensors displayed in numerical values,
including AQI (Air Quality Index).
V2.2 - 9/09/2020