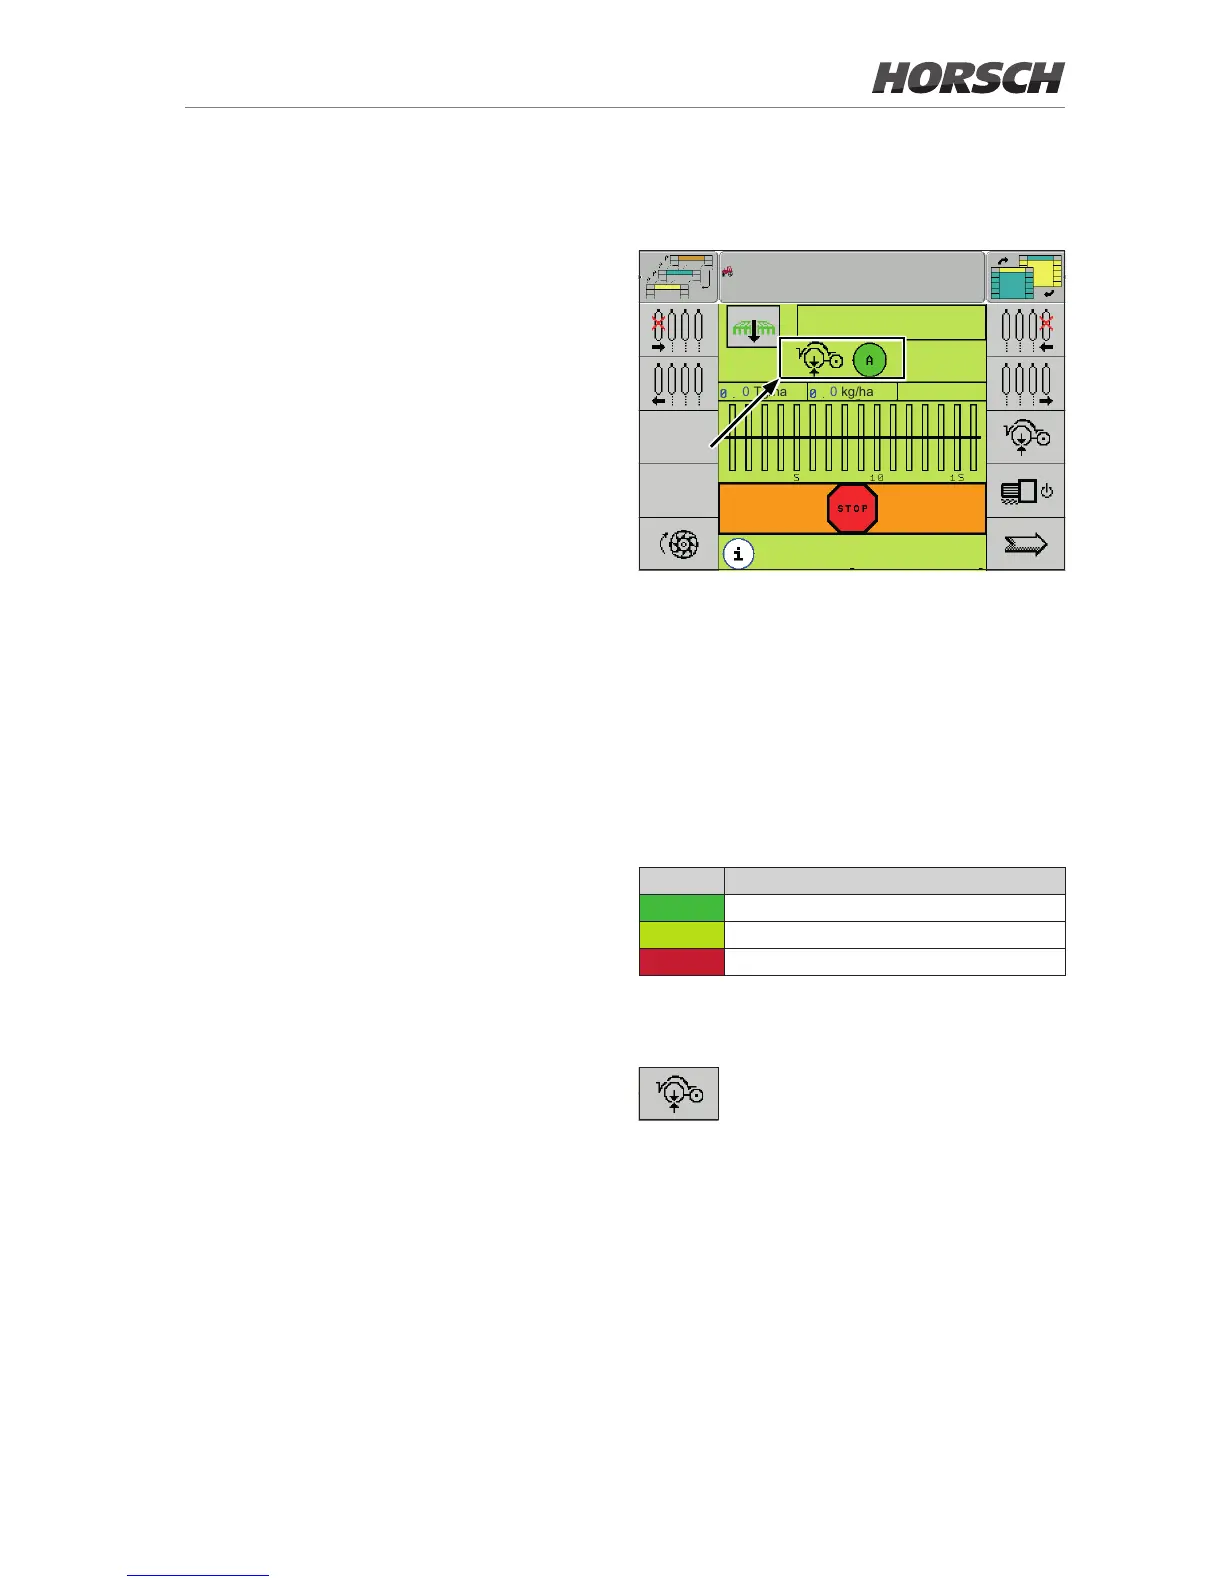
3. The lower area of the display shows bar
graphs for one installed and congured sec-
tion each.
Only the average value is displayed if all actu-
al values (values of the individual sensors and
their average value) are in the green range.
A grey arrow for the respective value and
the associated row number is displayed in
addition if at least one value lies outside the
green range.
Automatic mode work
screen
0.0
km/h
0 Tg/ha 0 kg/ha
maize
Work screen
The work screen shows the coulter pressure
symbol together with the circle. The circle has
dierent colours according to the status (red/
yellow/green). The colour of the circle always
represents the value of the worst sensor.De-
pending on the terminal, the symbol can be
selected by rotary wheel or touch.
The following table explains the meaning of the
dierent colours of the dot:
Colour Meaning
green Coulter pressure okay.
yellow Coulter pressure too high.
red Coulter pressure too low.
Depending on the terminal, the symbol can be
selected by rotary wheel or touch.
Tool key to access the AutoForce
screen.