Statistical Calculations
131
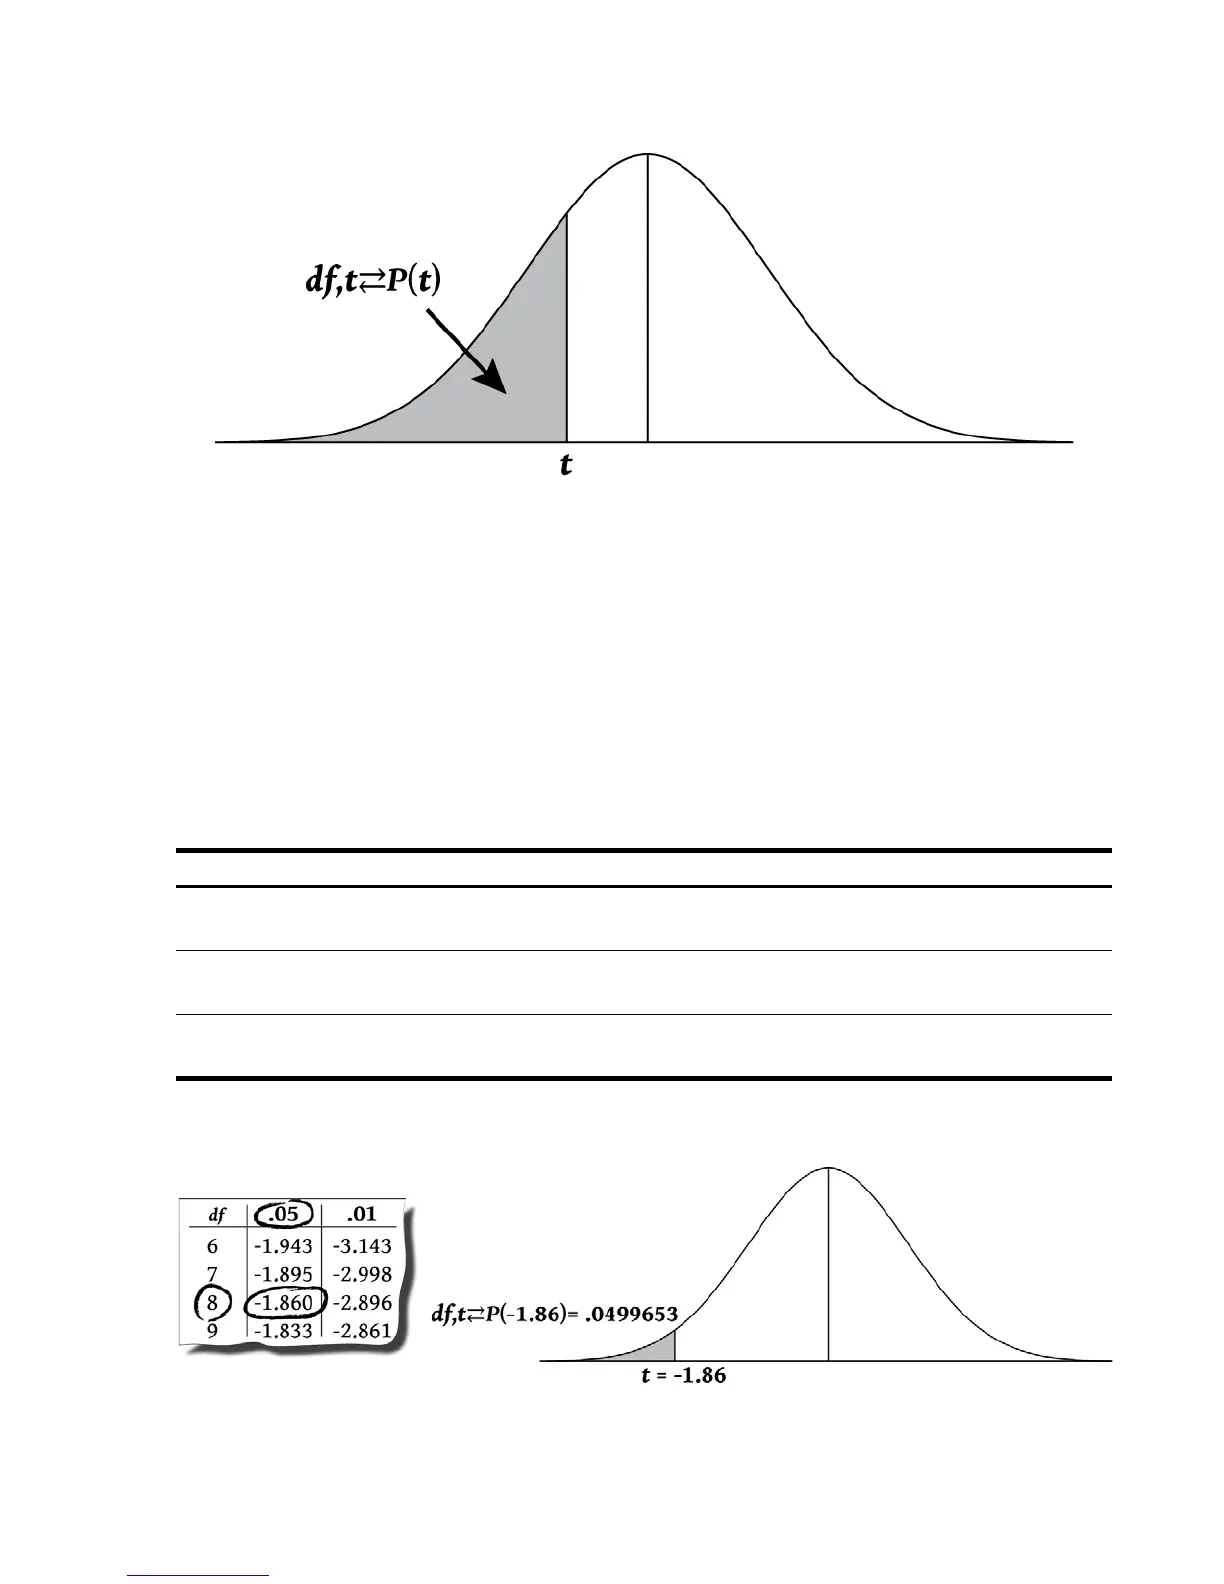
Student's T Probability Lower Tail
Figure 11
To calculate the area under the Student's T Distribution curve, first enter the degrees of
freedom, followed by the t-value. It is a two-number function, so it may be entered as either
an in-line function, or by using Æ.
Example:
What is the lower tail probability associated with a Student’s T distribution with 8 degrees of
freedom (df
1
) with a t-value of -1. 8 6 ?
Table 12-21 Example of Student’s t (lower tail)
Keys Display Description
g]IJ7gSy4
.0499653 Calculates the lower tail
probability.
or, using
Æ:
gÆJ7gSy]I
Returns the same results.
Figure 12 Figure 13