Statistics 103
Example 1:
A manufacturer observes declining sales of a soon-to-be obsolete product, of
which there were originally 10,000 units in inventory. The cumulative sales figures over a
number of months, given below, may be approximated by a logarithmic curve of the form
y = A + B (ln x), where y represents cumulative sales in units and x the number of months
since the beginning. How many units will be sold by the end of the eighth month?
Month
1 2 3 4 5 6
Cumulative
Sales (units)
1431 3506 5177 6658 7810 8592
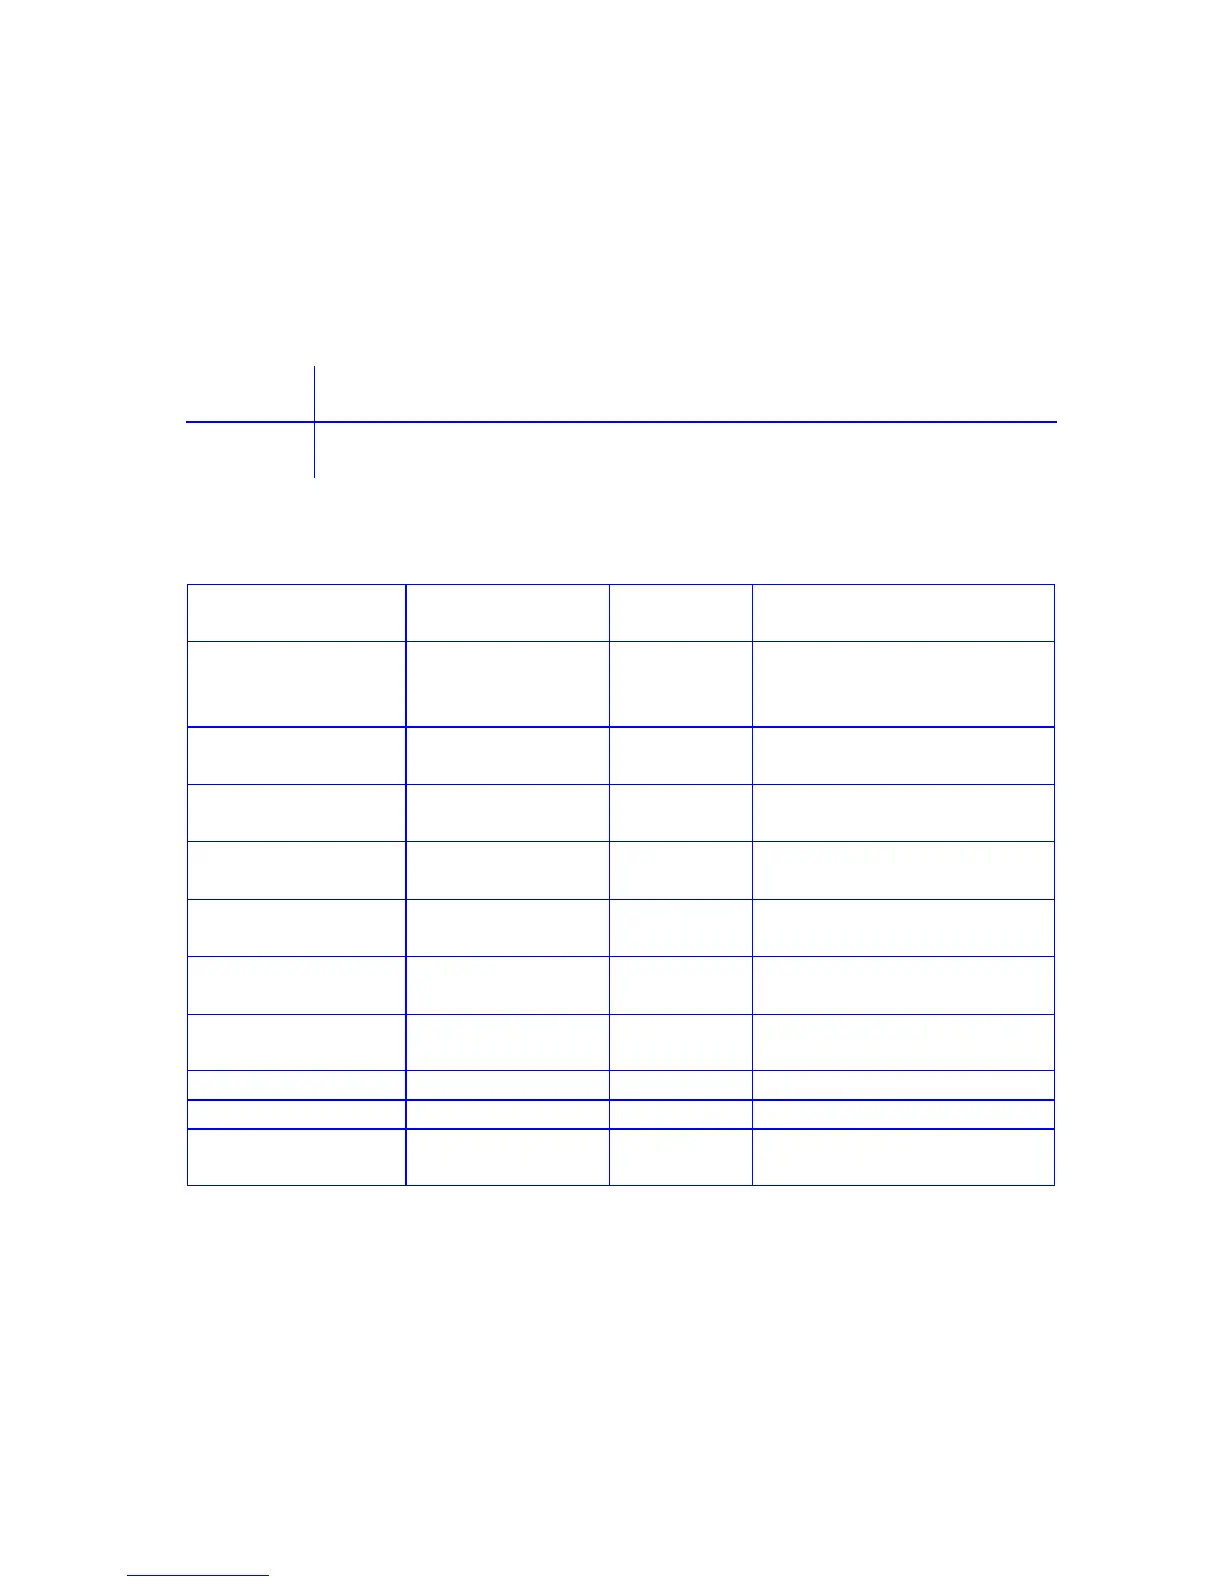
12c platinum / 12C
RPN Keystrokes
12c platinum
ALG Keystrokes
Display Comments
fCLEARH fCLEARH
1431\ 1431³
1g°_ 1g°_
1.00
First pair data input.
3506\ 3506³
2g°_ 2g°_
2.00
Second pair data input.
5177\ 5177³
3g°_ 3g°_
3.00
Third pair data input.
6658\ 6658³
4g°_ 4g°_
4.00
Fourth pair data input.
7810\ 7810³
5g°_ 5g°_
5.00
Fifth pair data input.
8592\ 8592³
6g°_ 6g°_
6.00
Sixth pair data input.
gR~ gR~
0.99
Correlation coefficient
(between y and ln x).
1gR0gR 1gR0gR
1,066.15
Value of A.
~d- -~d³
4,069.93
Value of B.
8g°gR 8g°gR
9,529.34
Total units sold by end of
eighth month.

 Loading...


