Statistics 109
12c platinum / 12C
RPN Keystrokes
12c platinum
ALG Keystrokes
Display Comments
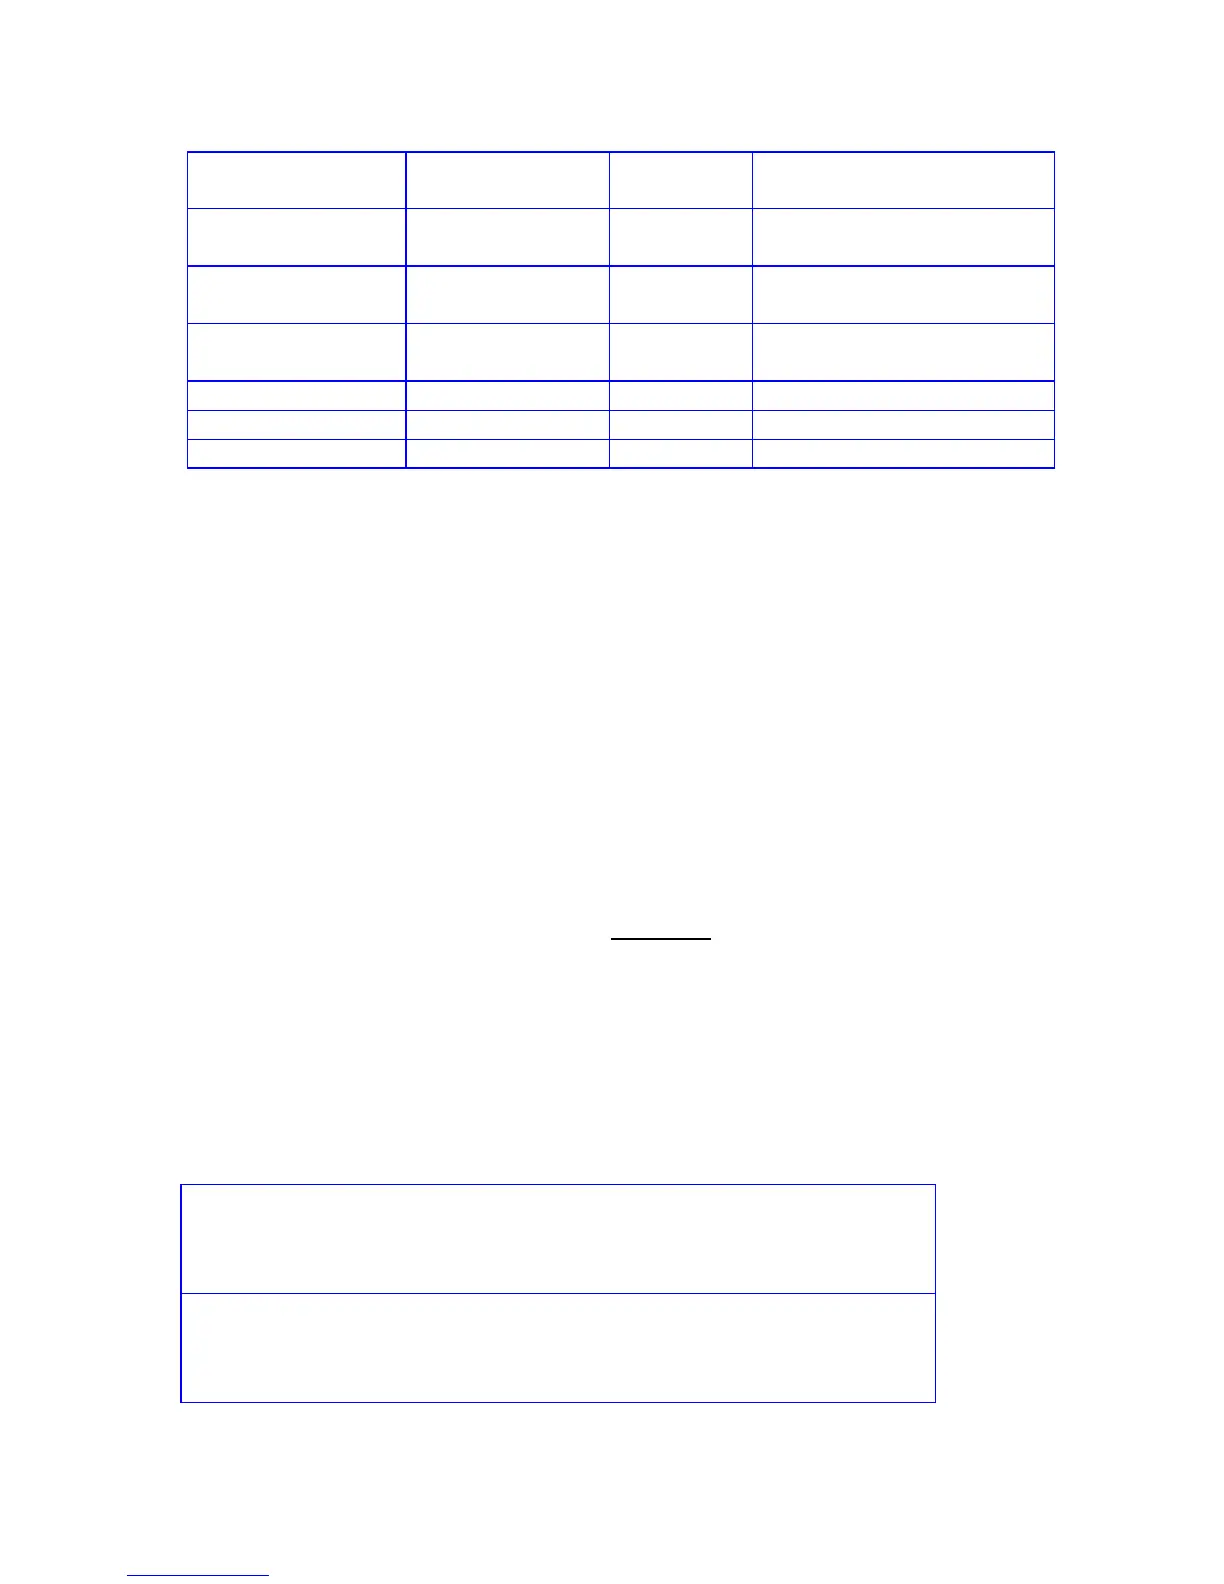
195\\ 195³
32t 32t
2.00
Second data pair.
200\\ 200³
88t 88t
3.00
Third data pair.
206\\ 206³
92t 92t
4.00
Total number of data sets.
g(005t g(009t
199.44
Average monthly rent (mean).
t t
5.97
Standard deviation.
t t
0.37
Standard error of the mean.
Chi-Square Statistics
The chi-square statistic is a measure of the goodness of fit between two sets of
frequencies. It is used to test whether a set of observed frequencies differs from a set of
expected frequencies sufficiently to reject the hypothesis under which the expected
frequencies were obtained.
In other words, you are testing whether discrepancies between the observed frequencies
(O
i
) and the expected frequencies (E
i
) are significant, or whether they may reasonable be
attributed to chance. The formula generally used is:
)
∑
=
−
=
n
i
i
ii
E
EO
1
2
2
χ
If there is a close agreement between the observed and expected frequencies,
χ
2
will be
small. If the agreement is poor,
χ
2
will be large.
The following keystrokes calculate the
χ
2
statistic:
1.
Press
fCLEARH .
RPN Mode:
2.
Key in the first O
i
value and press \ .
3.
Key in the first E
i
value and press ?0-\§:0z+ .
ALG Mode:
2.
Key in the first O
i
value and press - .
3.
Key in the first E
i
value and press ?0³g’z:0+~³.
4. Repeat steps 2 and 3 for all data pairs. The χ
2
value is displayed.

 Loading...