154
As before, a more visual display can be seen
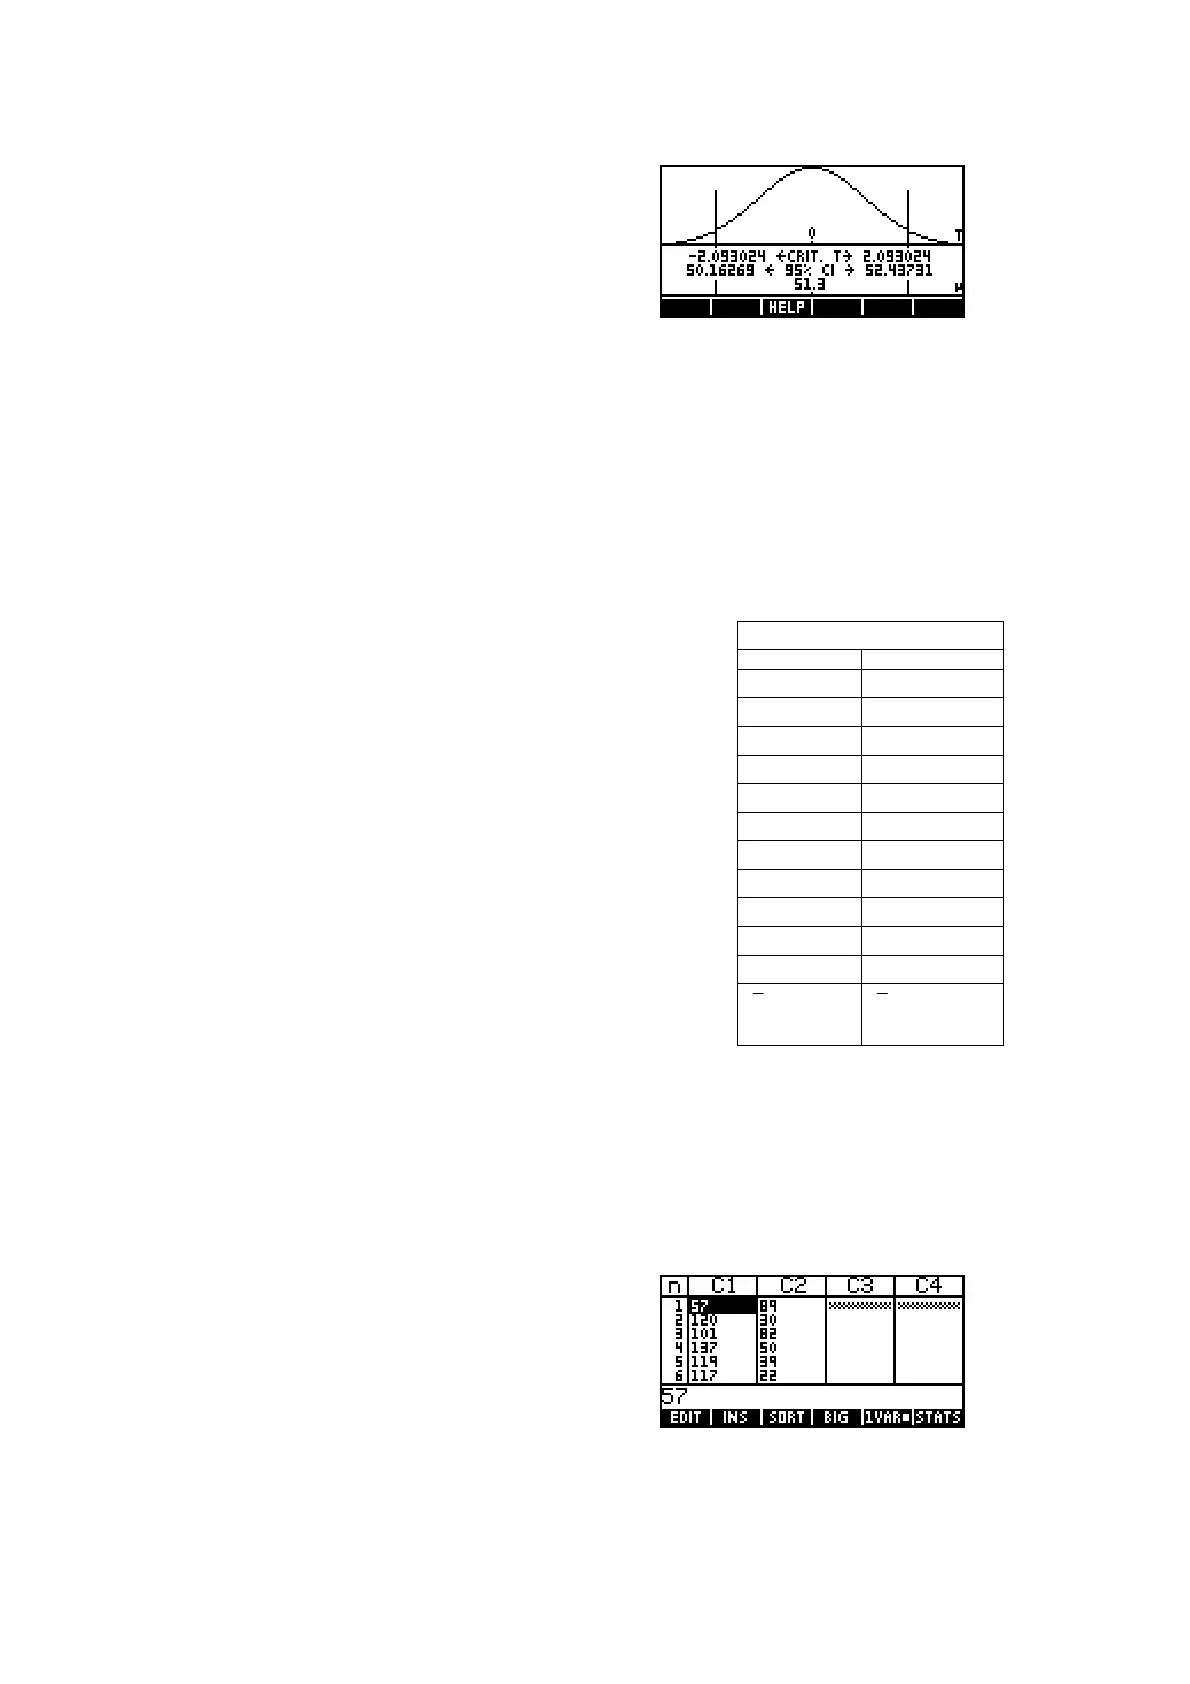
in the PLOT view.
Thus the sample data indicates in our two
examples that:
! we can be confident the average number of matches is not 50 with
less than a 5% chance of being wrong, and
! we can conclude, with a confidence of 95%, that the true average
number of matches is between 50.16 and 52.44.
Hypothesis test: T-Test
µ
1
-
µ
2
A farmer compared the 15-day mean weight of two
sets of chicks, one group receiving feed supplement A
and the other supplement C. Twenty two chicks only
one day old were assigned randomly to the two
groups. To distinguish between the two groups of
eleven, which were caged together to minimize other
influences, the heads of the chicks were stained red
and purple respectively with a harmless vegetable
dye. The individual weights were recorded in the
table to the right. From the means at the bottom of
the table it appears that supplement A produces a
higher mean weight. The farmer wishes to know, at
the 1% test level, whether this is statistically
significant.
Our hypotheses are:
H
0
: The effects are the same
)
12
µ
=
H
A
: Supplement A is better
()
12
µ
>
Enter the data into columns C1 and C2 of the
Statistics aplet.
Weights
Supplement A Supplement C
57 89
120 30
101 82
137 50
119 39
117 22
104 57
73 32
53 96
68 31
118 88
=97
X
=27.75
=56
X
=26.54

 Loading...


