97
Decimal, Integer & Trig
The next option of Decimal resets the scales
so that each pixel (dot on the screen) is exactly
0
.
1. The result is an X scale of 65 65x−⋅ ≤ ≤ ⋅
and a Y scale of 31 32y−⋅≤ ≤ ⋅ . This may not
give the best view of the function. Personally I
don’t often use it, as it is generally easier to go
to the PLOT SETUP view and press SHIFT CLEAR.
The Integer option is similar to decimal, except
that it sets the axes so that each pixel is 1
rather than 0.1 thus giving an X scale of
65 65X−≤≤ .
The usual result of this is rather horrible.
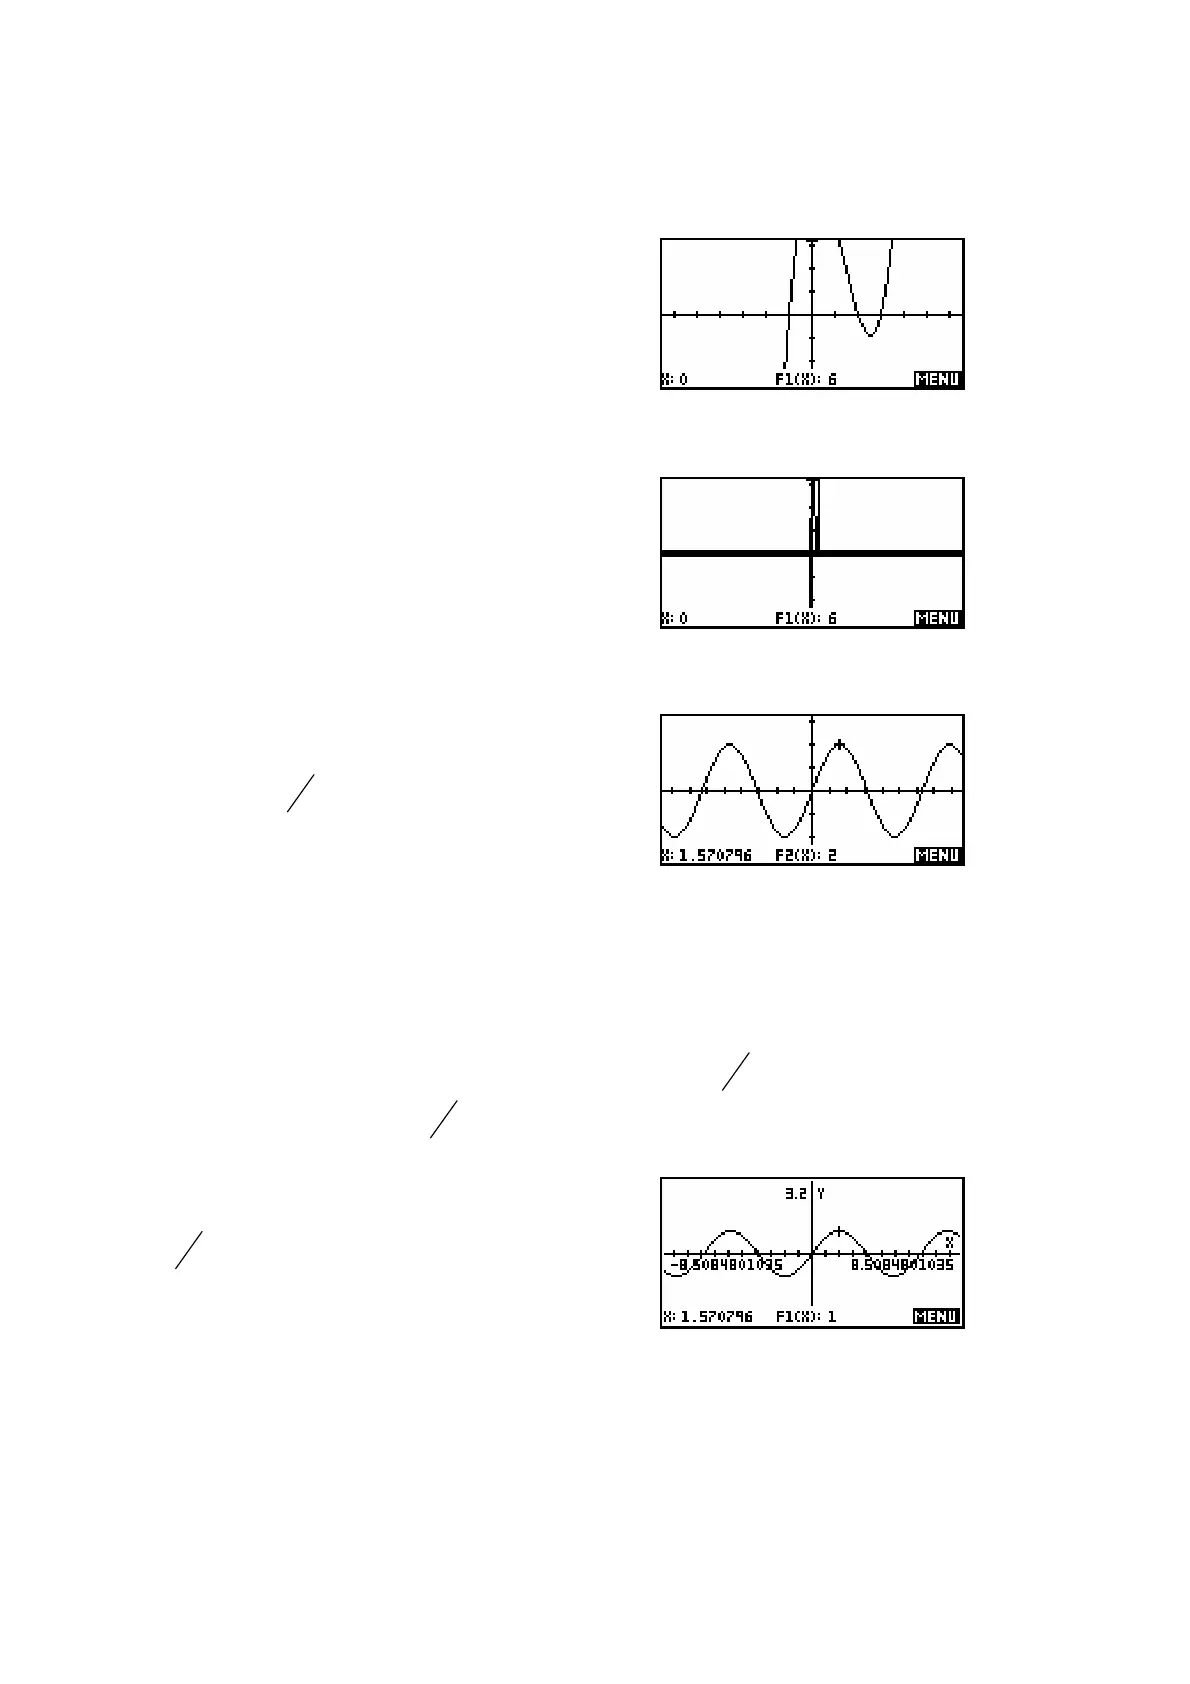
The final option of Trig is designed for
graphing trig functions. It sets the scale so
each pixel is
24
. This means that if you
were graphing 1( ) 2 sin( )FX X= then 24
presses of the left or right arrows would move
you through exactly
and the value would be exactly 2 instead of a horrible
decimal.
If you zoom in or out from this, the jumps will still stay relatively nice,
particularly since 24 has so many factors. For example, with a zoom factor of
2, zooming out once would mean each pixel was now
48
, while zooming in
would give a pixel jump of
12
.
As you can see, the cursor is nicely at a value
of
2
, giving a y value of exactly 1 instead of
only very close.

 Loading...


