157
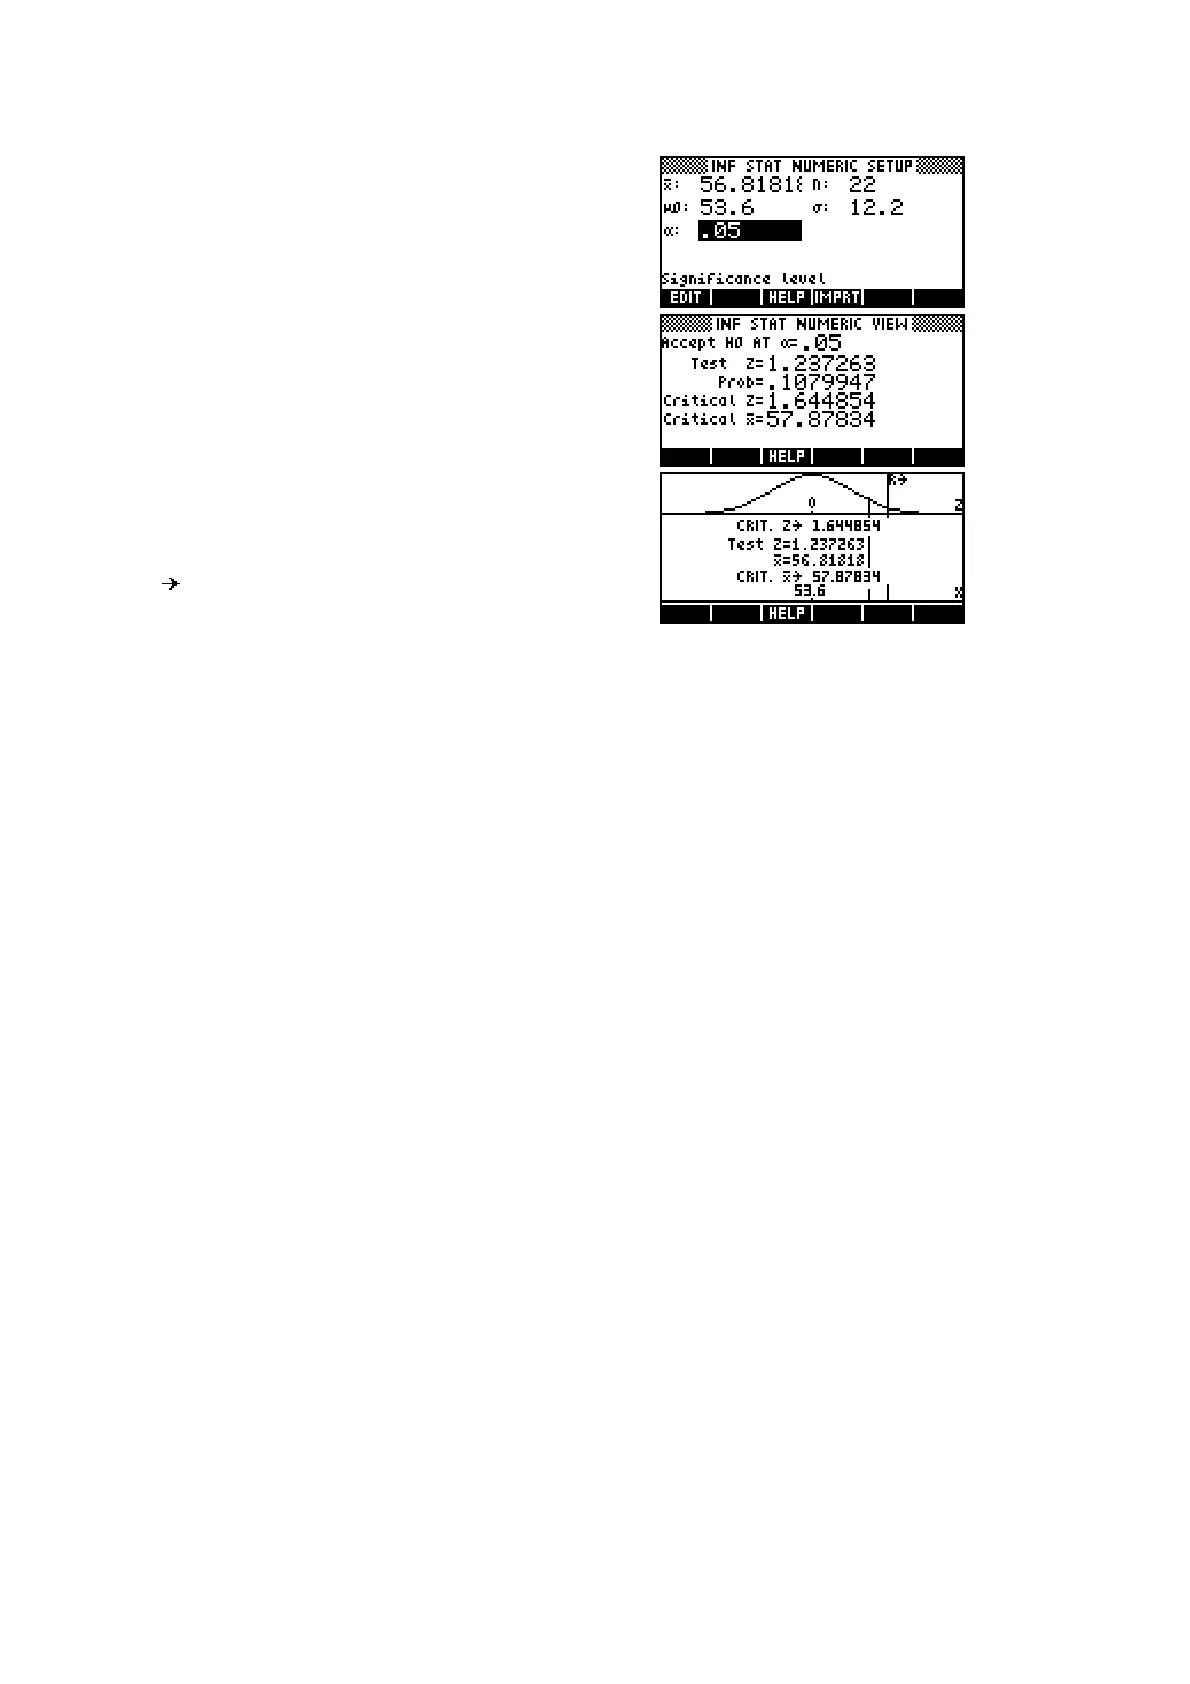
Enter the values for the mean and standard
deviation of the standardized test, and the
significance level of 0.05 (5%).
If we now change to the NUM view we can see
that the test z score is less than the required
critical z*, and the probability of obtaining a
mean of the value found is 0.1080, which is
larger than the required test value of 0.05.
In the PLOT view, we can see visually that the
vertical line representing the sample mean is
not within the region of rejection marked by the
R .
From the evidence the teacher must reject the alternate hypothesis and
conclude that it is not possible to say at the 5% level of significance that his
class has averaged significantly higher than the standardized population from
which the test was drawn. He should re-think his proposed paper or his new
teaching method. Alternatively, from the diagram in the PLOT view it seems
that his mean is not far from being significant. Perhaps he simply needs to
collect more data in the hopes that this may back up his view. The result he
has obtained is, after all, only a probability and further investigation may give
a different view.

 Loading...


