70
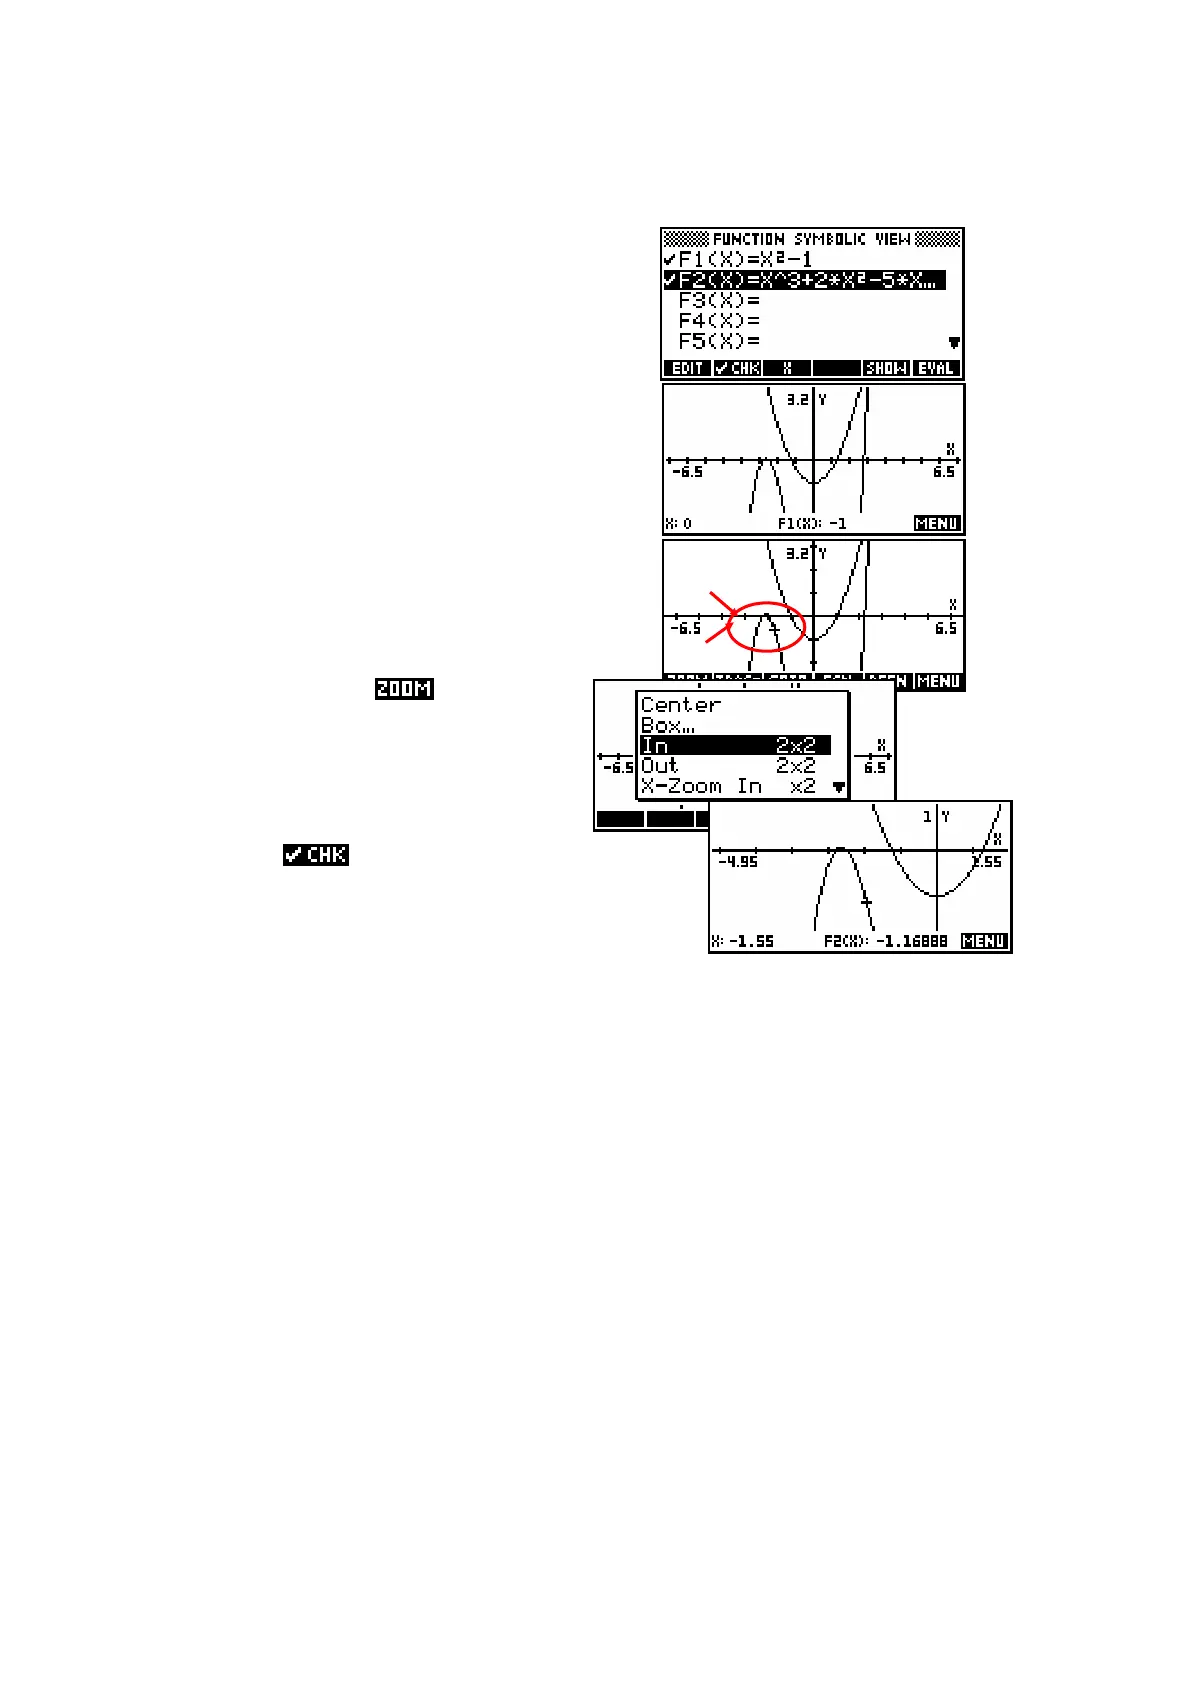
5. Another possible strategy for graphing which works quite well and,
perhaps importantly, always gives ‘nice’ scales is to use ZOOM.
! Enter your graphs into the SYMB
view. Remember that Auto Scale
only works on the first ticked
graph.
! Press VIEWS and choose
Decimal, or press SHIFT CLEAR
in the PLOT SETUP view. This
will give you the default axes,
probably not showing the graph
very well.
! Place the cursor so that it is in
the center of the area you are
most interested in.
! Use the menu to
adjust the view. You may
choose first to change the
zoom factors to something
other than 4x4, and to
ensure that Recenter: is
ed.
The advantage of doing it this way is that if you zoom in or out by a factor of
2 or 4 or 5, the cursor jumps will stay at (relatively) nice values allowing you
to trace more easily. In this case, the cursor now moves in jumps of 0
.
05,
which is ideal for most purposes. On the other hand you may not be
interested in tracing along the graph.

 Loading...


