Getting Started 7
Getting Started
7
Function Plot View
The Function Plot view displays the graphs of functions and provides you with the tools you need to explore these graphs. Here you can trace along a
graph, find roots and intersections, and estimate the area between curves. In this section, we continue the example from the last section using
and .
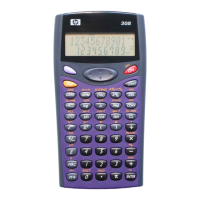
Next, enter in F2(X) and press ENTER. Your completed Function Symbolic View should be the same
as that shown in Figure 15. Note the CHK menu key. This menu key toggles each function definition on and
off for graphing and table-building. The check mark indicates an item is selected. The EVAL menu key
resolves references. If F2(X)=3-F1(X), pressing the EVAL menu key returns . The
SHOW menu key performs the same function it does in the Home view.
Figure 15
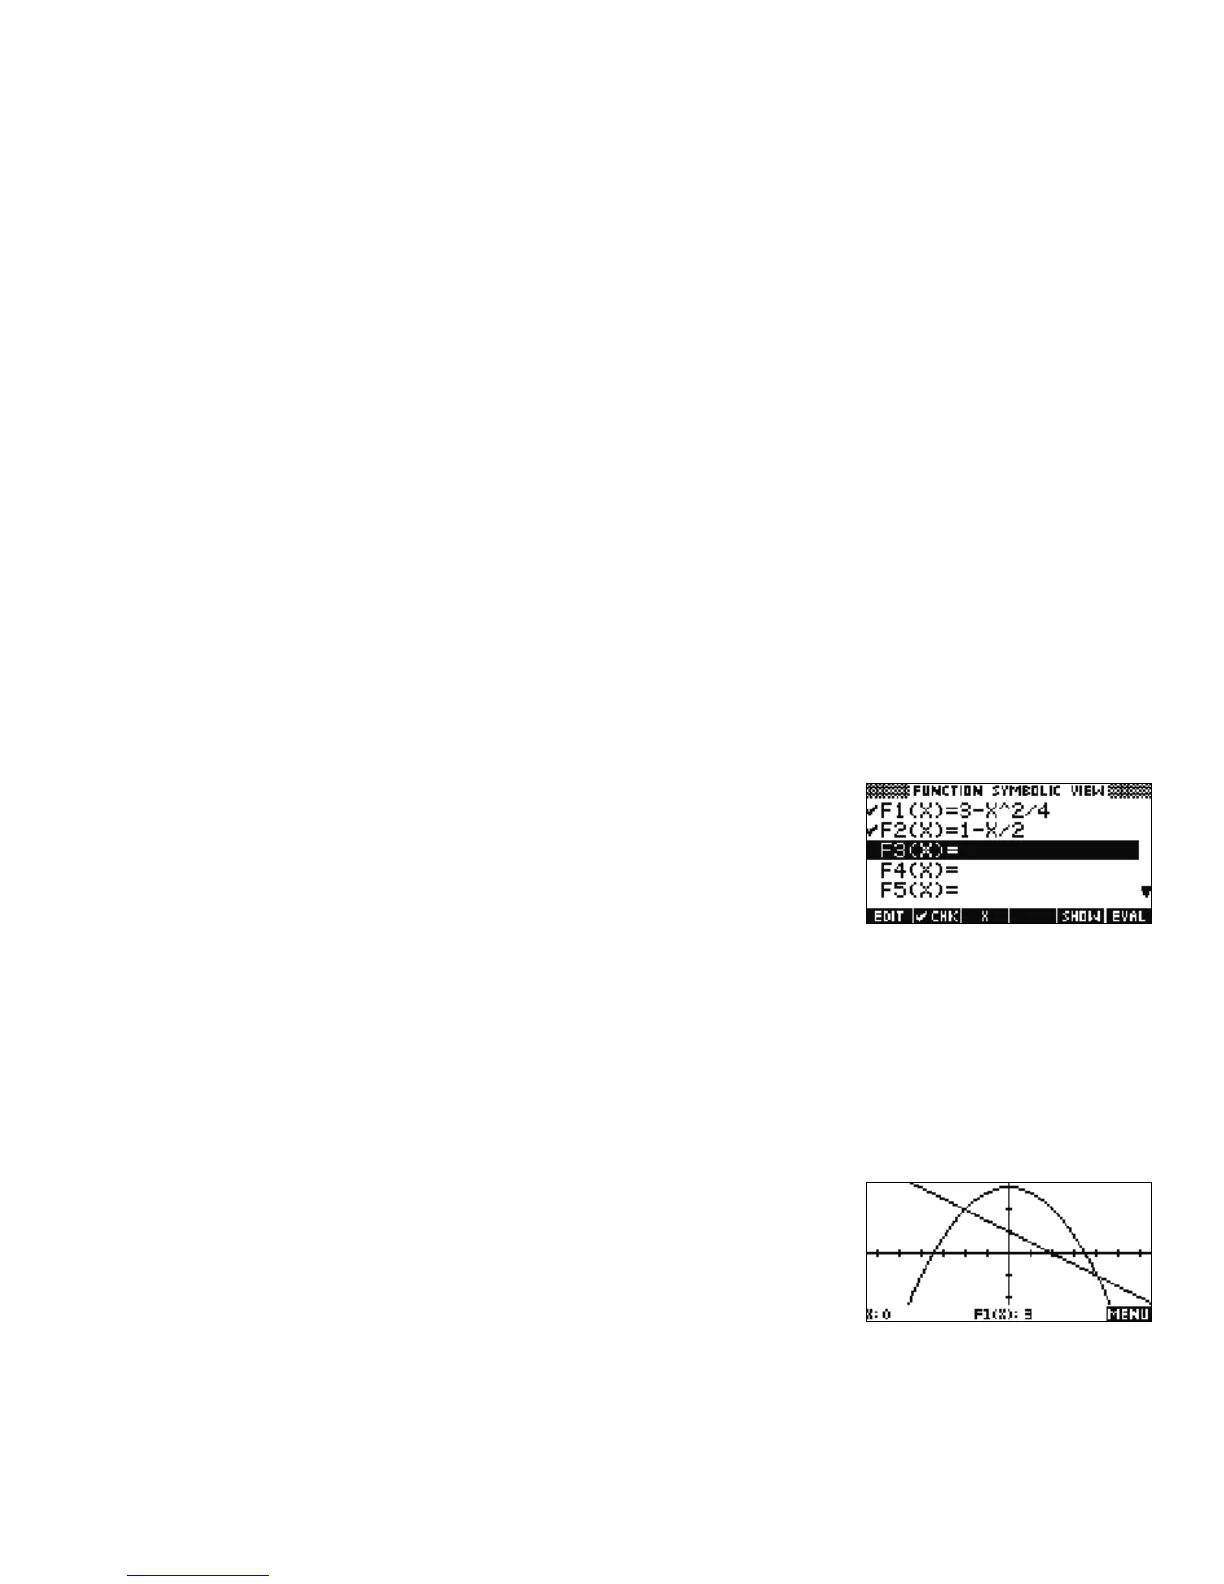
Press PLOT to see the graphs of the functions in the current window. See Figure 16.
Figure 16

 Loading...