8 Getting Started
Getting Started8
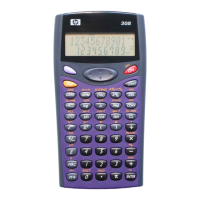
Before we continue, let's look at the default window settings. Press SHIFT followed by PLOT to open the
Function Plot Setup, as shown in Figure 17. The HP 39gs has 131 pixel columns, allowing the cursor to
make 130 steps from one vertical edge of the display to the other. The default setting for the horizontal
range (XRNG) is [-6.5, 6.5], a distance of 13 units. Thus, each pixel has a width of 0.1 units, very
convenient for tracing. Likewise, the display has 64 pixel rows, allowing the cursor 63 vertical steps. The
default YRNG of [-3.1, 3.2] makes the height of each pixel 0.1. The result is that the pixels are square,
graphs are accurately plotted, and tracing increments x-values by 0.1.
Figure 17
Return to the graphs by pressing the PLOT key. Press the MENU key to restore the menu (Figure 18). The
menu consists of 6 items:
• ZOOM opens the Zoom menu, with options to zoom in or out, etc.
• TRACE toggles the tracing cursor on and off. When active, it appears as in Figure 18, with a small
square replacing the letter E in TRACE
• GOTO lets you find any point on the curve being traced by entering a value for x.
• FCN opens the Function menu, with the following commands:
•Root
•Intersection
• Extremum (Maximum or Minimum)
•Slope
• Signed Area (the area under a curve or between two curves)
• DEFN displays the definition of the function being traced
• MENU toggles the menu on and off
Figure 18
Press the MENU key once to hide the menu. Then press the same key again to bring up the tracer
coordinates. This illustrates that tracing can occur with or without the tracer coordinates displayed.
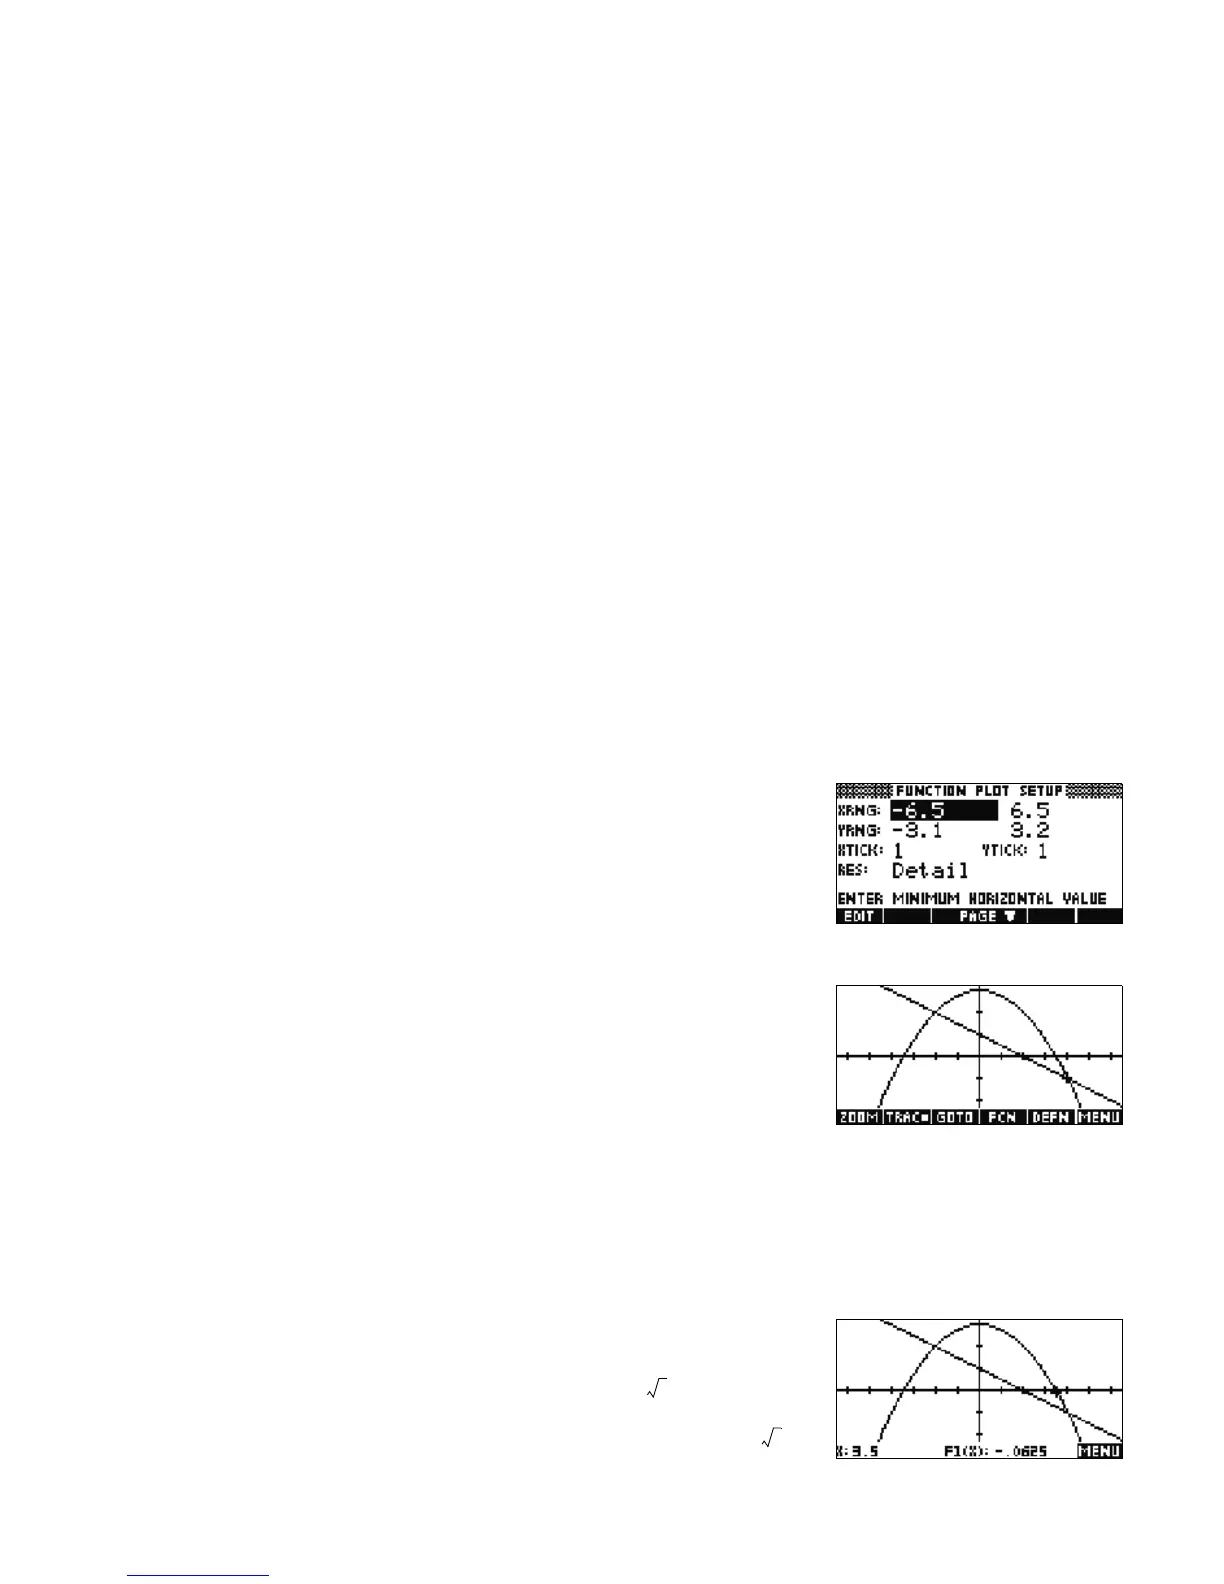
We continue our introduction to the Plot view by finding the root of F1(X) at . Use the LEFT and
RIGHT cursor keys to trace along F1(X). Use the UP and DOWN cursor keys to move between F1(X) and
F2(X). In Figure 19, the tracer has been moved along F1(X) to the pixel closest to the root at .
Figure 19

 Loading...