20 Getting Started
Getting Started20
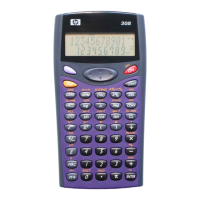
Press PLOT to enter the Plot view. In this view, the left side of the current equation and the
right side of the current equation are plotted as two separate graphs. The variable that is
highlighted in the Solve Numeric View is taken as the independent variable for graphing
purposes.
• MENU: this toggle reveals and hides the Plot menu, with options for zooming and tracing
• ZOOM: enters the Zoom menu, with options to zoom in or out
• TRACE: toggles tracing cursor off and on
• GOTO: takes the tracing cursor to the point on the function with a given x-value
• DEFN: displays the symbolic definition of the current function
Solve Plot View
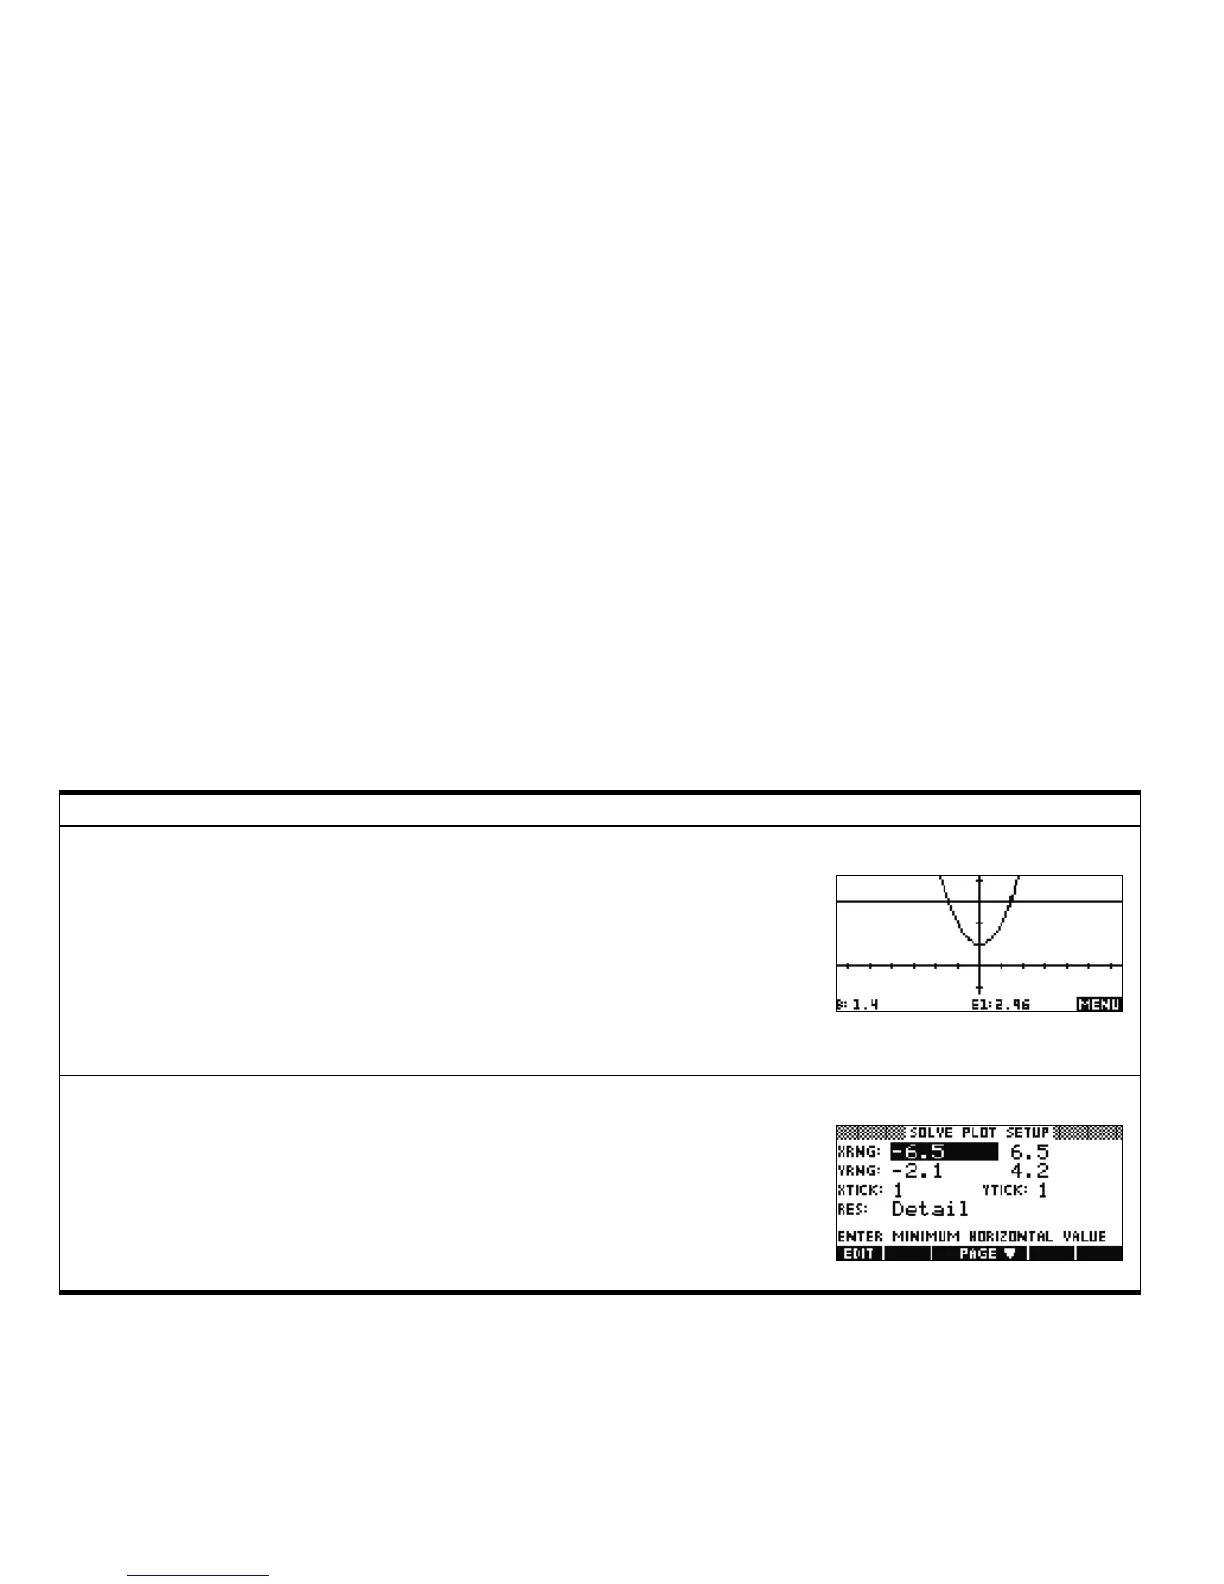
Press SHIFT followed by PLOT to enter the Plot Setup. Page 1 of the Solve Plot Setup is the
same as page 1 of the Function Plot Setup. The purpose of the page is to allow you to
manually set up the graphing window and the appearance of the graphs.
Solve Plot Setup Page 1
Table 1-2 Solve Aplet Summary
Summary of Functionality Veiw Name and Display

 Loading...