Getting Started 27
Getting Started
27
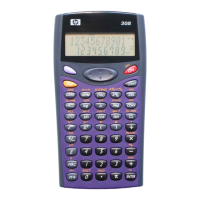
Press the 1VAR/2VAR menu key to toggle it to 2VAR, then press SYMB to enter the 2VAR
Symbolic view. You can define up to 5 2-variable analyses (S1, S2, … S5) by choosing the
independent and dependent columns of data involved in each analysis. The menu is the
same as the 1Var Symbolic view above. This view also shows the current fit type for each
scatter plot. If the scatter plot has been drawn and the fit plotted, the specific equation for
the fit is shown here as well. You can enter your own fit expression in x if you wish.
Statistics Symbolic View 2VAR
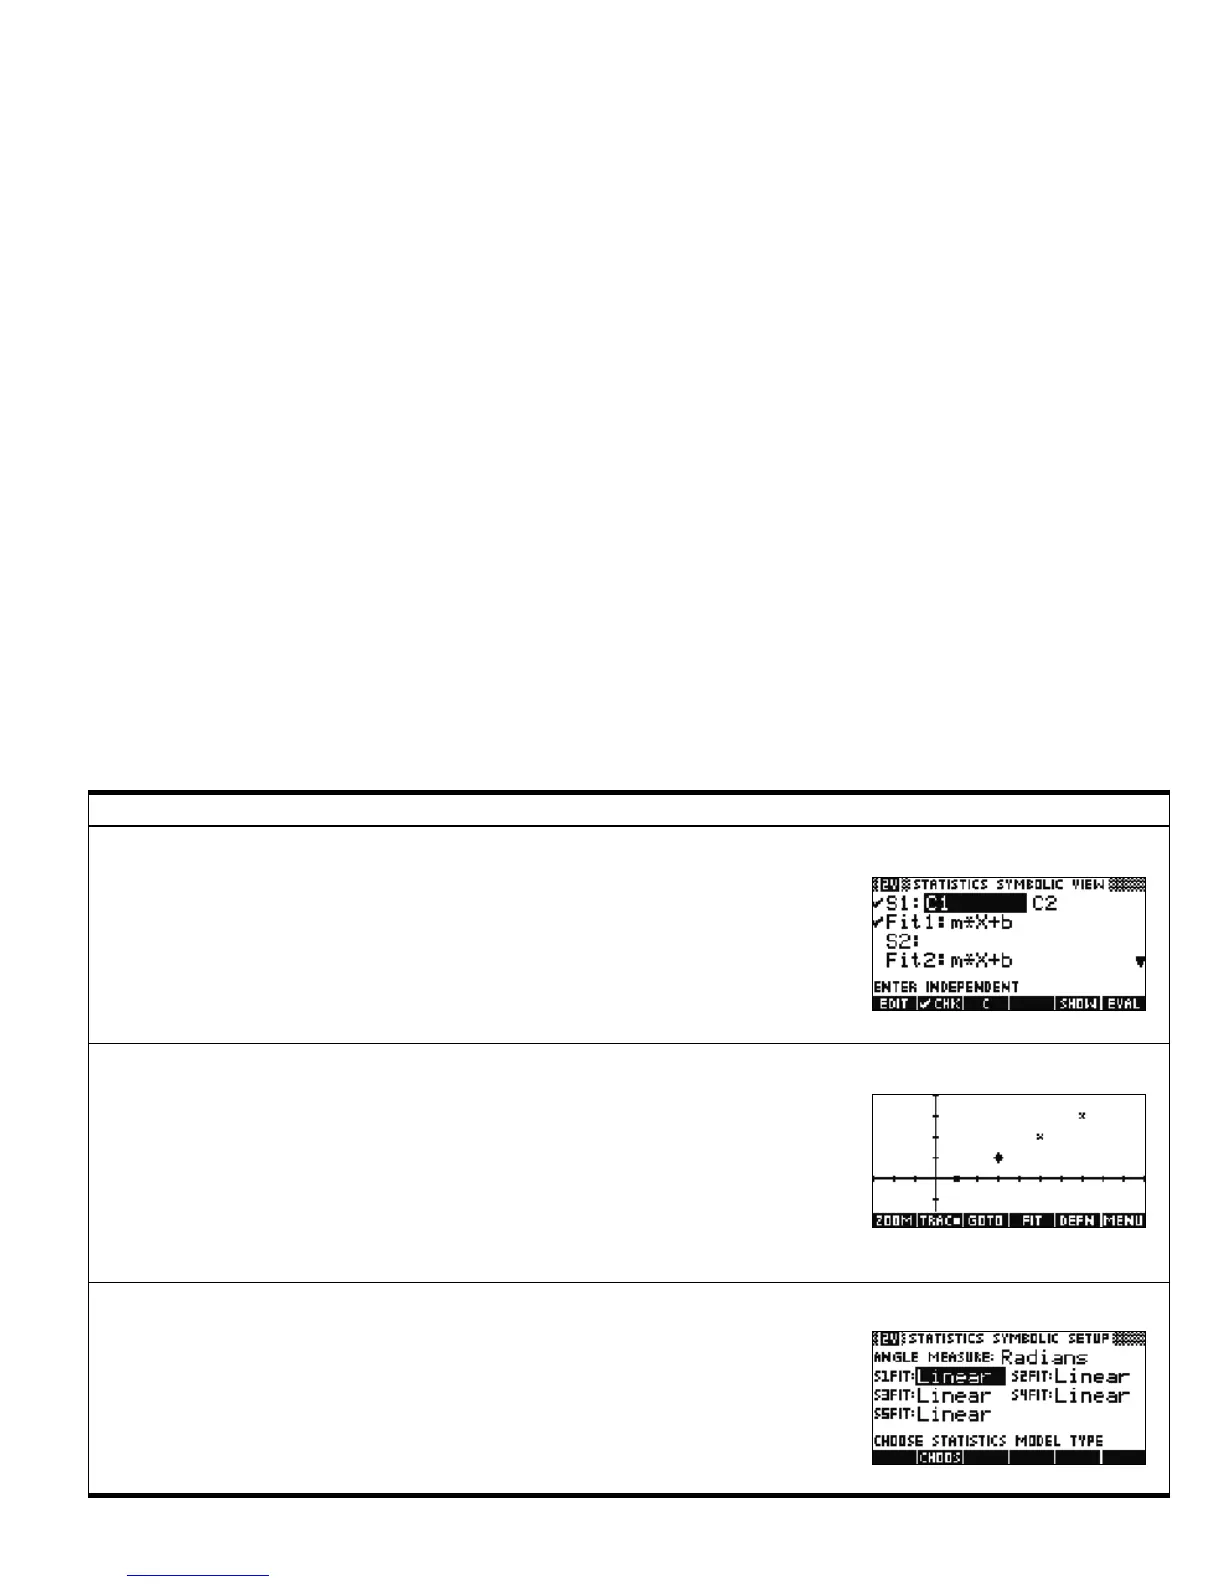
With the 1VAR/2VAR menu key toggled to 2VAR, press PLOT to enter the 2Var Plot view.
This view displays scatter plots of numerical data and function fits for each scatter plot. The
menu items are:
• ZOOM: zoom in or out on the graph(s)
• TRACE: toggle tracing on and off
• GOTO: jump to a desired data point
• FIT: toggle displaying a fit for each scatter plot
• DEFN: show the definition of the current graph being traced
• MENU: reveal and hide the menu
Statistics Plot View 2VAR
With the 1VAR/2VAR menu key toggled to 2VAR, press SHIFT followed by SYMB to enter
the Symbolic Setup. This view lets you select the fit type for each scatter plot in the Symbolic
view. By default, each fit is set to linear. The only menu item is:
• CHOOSE: displays a list of the available options for each field
Statistics Symbolic Setup 2VAR
Table 1-4 Statistics Aplet Summary
Summary of Functionality View Name and Display

 Loading...