26 Getting Started
Getting Started26
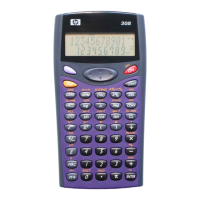
With the 1VAR/2VAR menu key toggled to 1VAR, press PLOT to enter the 1Var Plot view.
This view displays histograms or box-and-whisker plots for active analyses. The menu is
similar to the Function Plot View, with options for zooming and tracing.
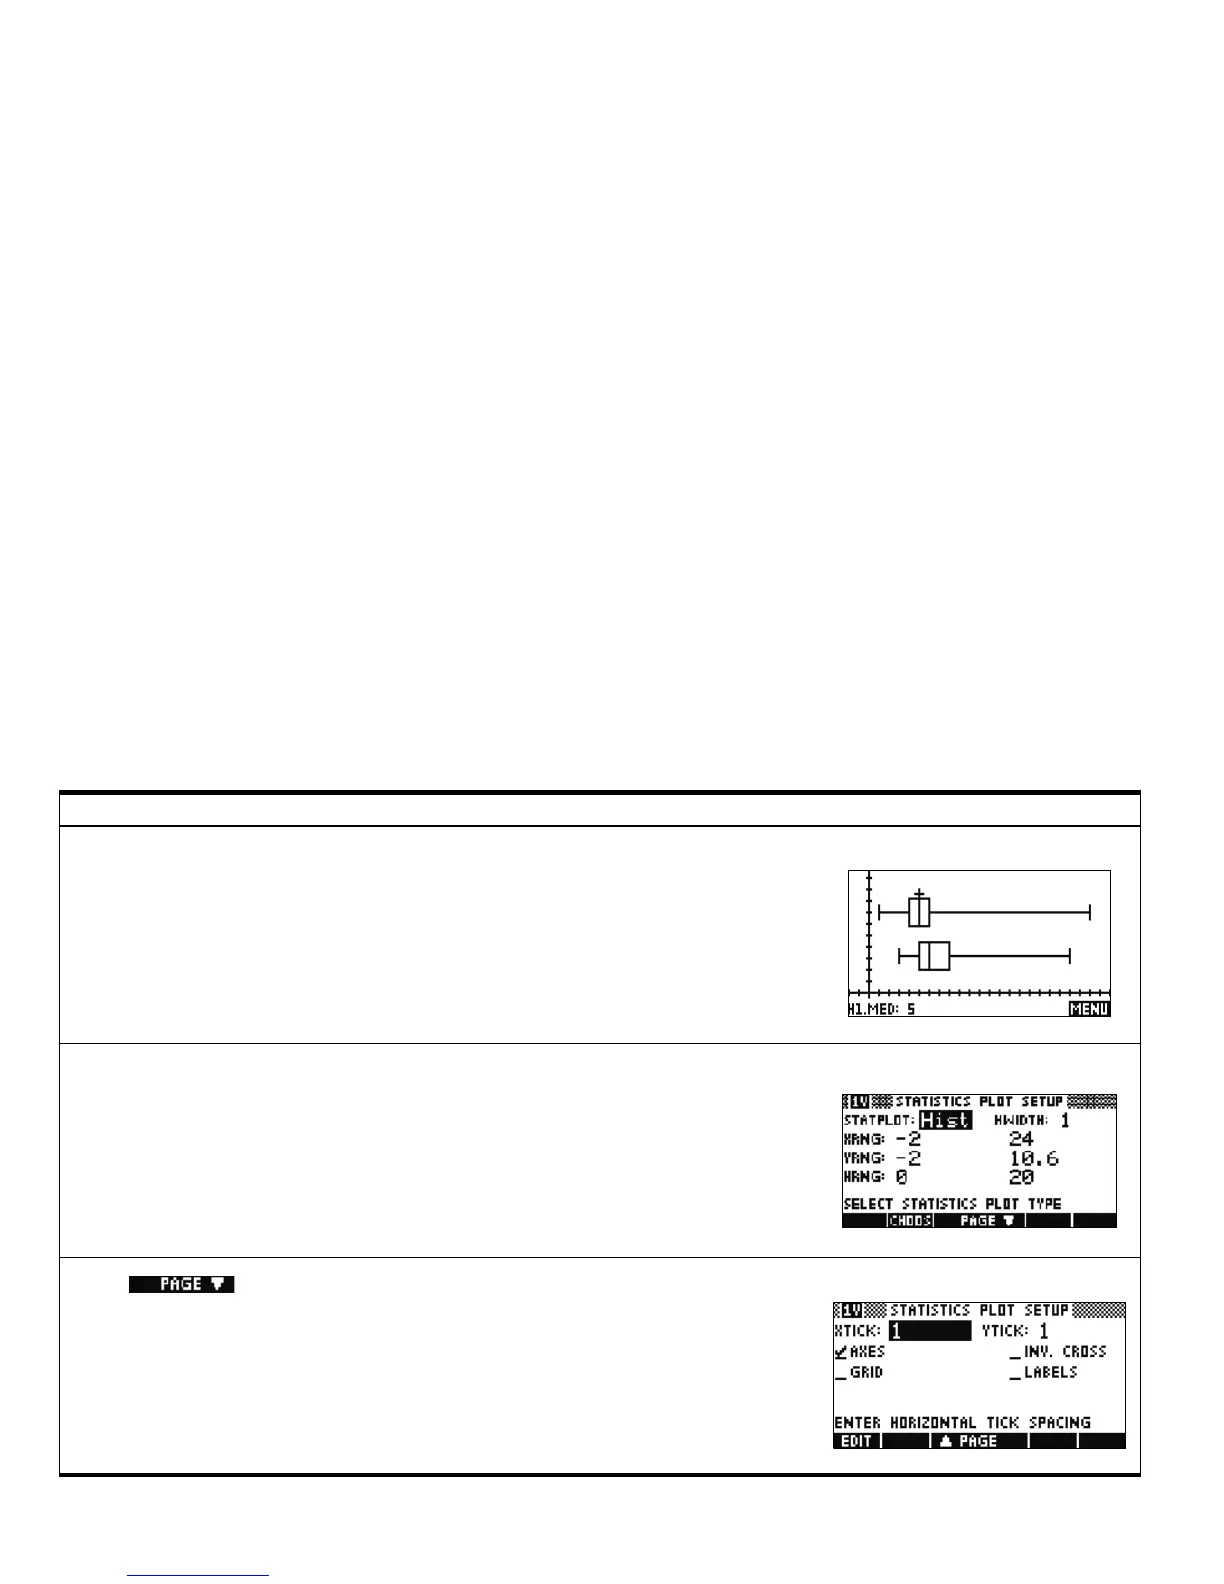
Statistics Plot View 1VAR
With the 1VAR/2VAR menu key toggled to 1VAR, press SHIFT followed by PLOT to enter the
1Var Plot Setup. Page 1 of the 1Var Plot Setup contains settings that control the appearance
of 1-variable statistical plots.
• STATPLOT: choose between Histogram and Box-and-Whisker statistical plot types
• HWIDTH: the bin width for histograms
• XRNG: the horizontal range of the graph window
• YRNG: the vertical range of the graph window
• HRNG: the range for the data to plot
Statistics Plot Setup Page 1 1VAR
Press to enter the second page of the 1Var Plot Setup. This view contains
further settings to control the appearance of the graphing window and the plots. This view is
nearly identical to page 2 of the Sequence Plot Setup, except that there is no SIMULT
setting.
Statistics Plot Setup Page 2 1VAR
Table 1-4 Statistics Aplet Summary
Summary of Functionality View Name and Display

 Loading...