19
LP- 428 REV. 9.2.14
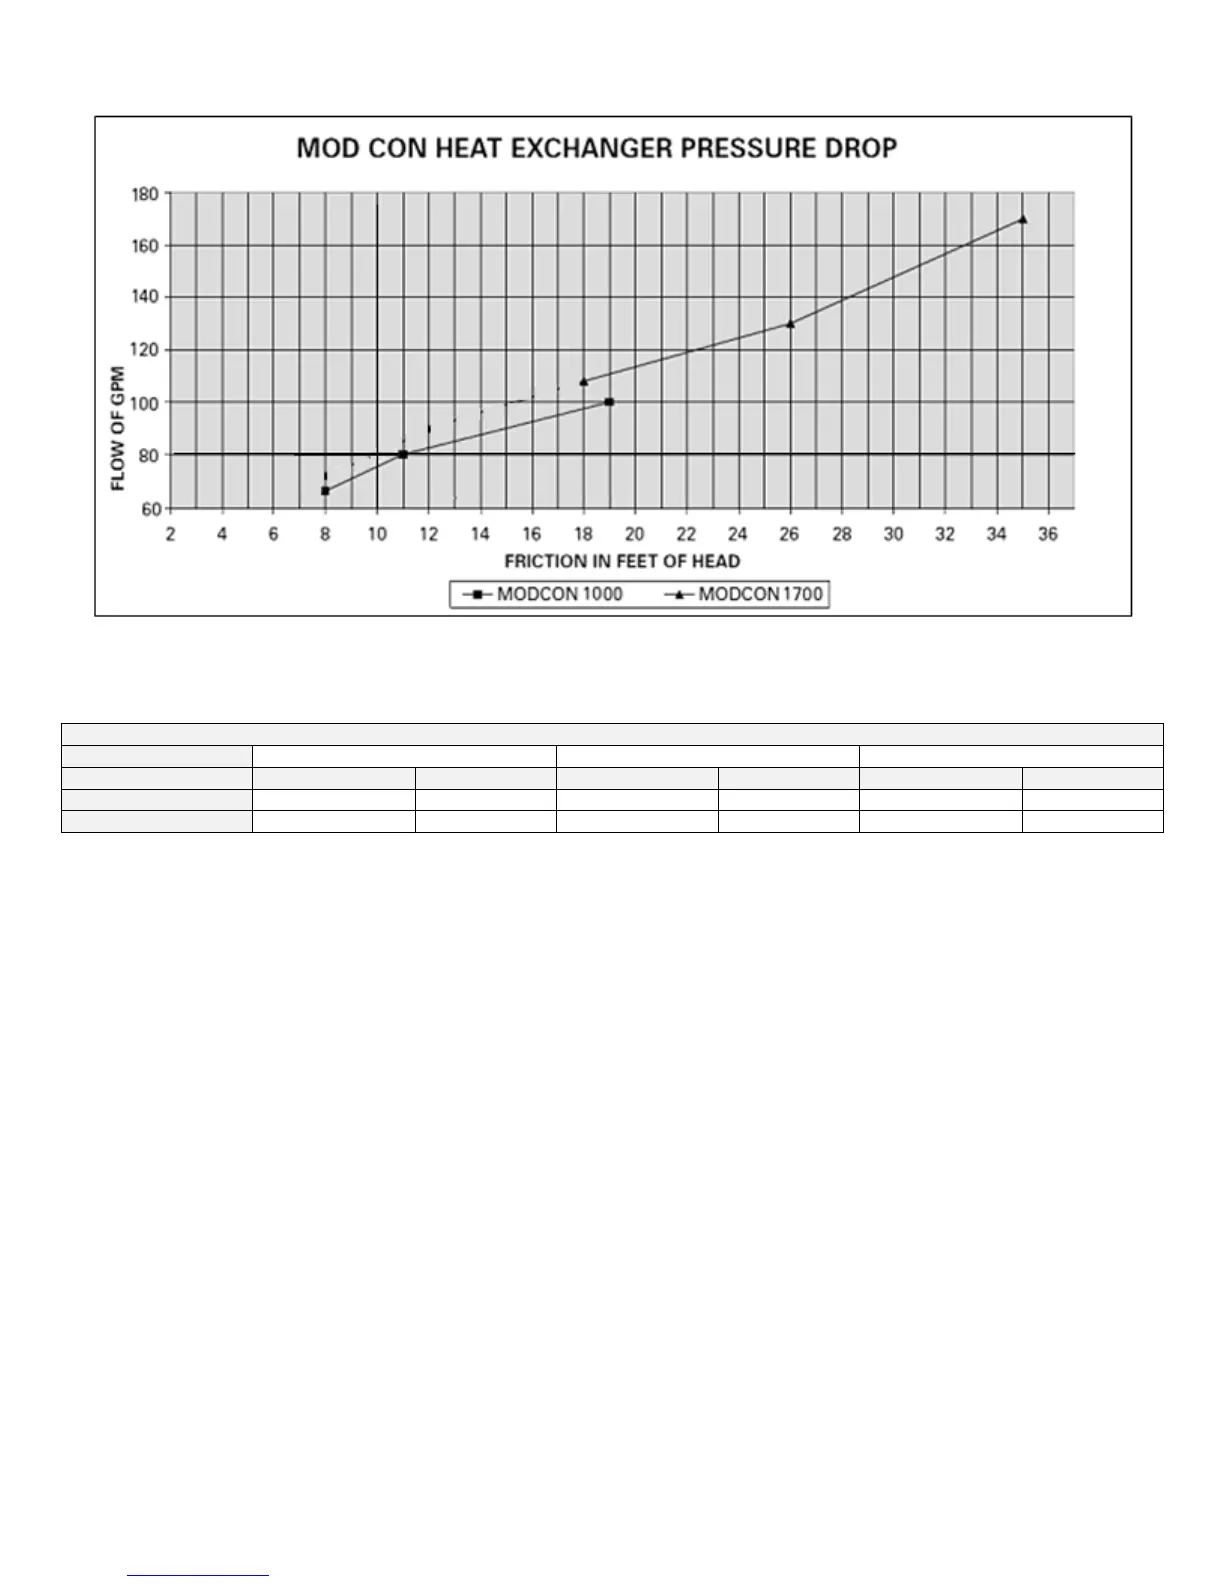
Figure 5 – Heat Exchanger Pressure Drop Chart
Table 4 represents the various system design temperature rise through the boiler, along with respective flows and friction loss which will
aid in circulator selection.
SYSTEM TEMPERATURE RISE CHART
Table 4 – Temperature Rise Chart
Figure 6 represents the combined flow rates and pipe sizes when using multiple boilers to design the manifold system for the primary
circuit. To size, simply add up the number of boilers and the required flow rates for the system design temperature.