Table 4 Sensor modes (continued)
Sensor mode Description
Master controlled
mode
Sensor measurements are triggered by the microcontroller, which
enables high flexibility.
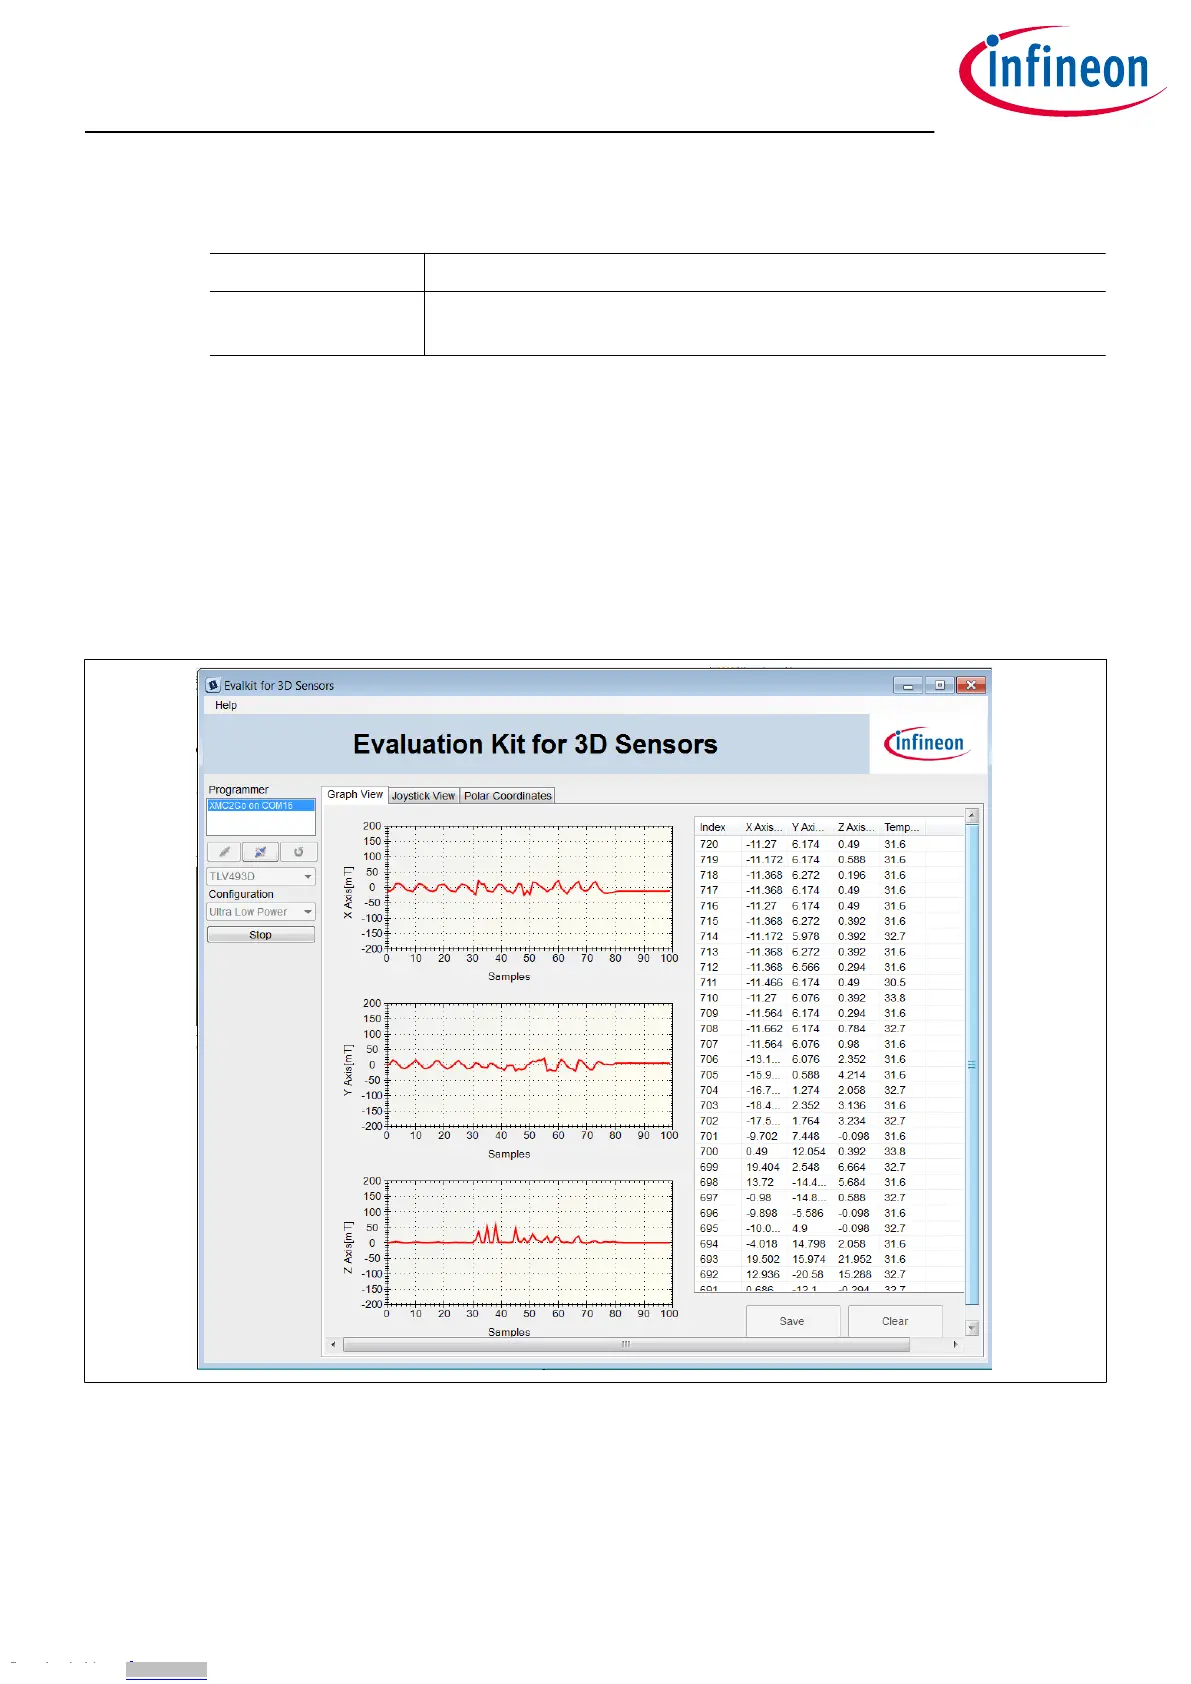
4.2 Graph View
The graph view displays the magnetic field measurements in X, Y and Z direction.
Figure 26 shows the graph view window. On the le hand side there are three histograms which plot the
magnetic field for each measured sample. On the right a table displays all measured data, including the
temperature. With the save button it is possible to export the measurement data into a .csv file. This is
especially helpful for processing the data aerwards. .
If a new mode should to be evaluated click the Stop button on the le control panel. Save the data and Clear it.
Select a new configuration and click again on Start to begin the new evaluation.
Figure 26 Graph view
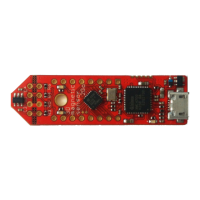
3D Magnetic Sensor 2 Go - TLE493D-A2B6
Low Power 3D Hall Sensor with I²C Interface
3D magnetic sensor evaluation
User Manual 20 1.0
2018-05-16
Downloaded from Arrow.com.Downloaded from Arrow.com.Downloaded from Arrow.com.Downloaded from Arrow.com.Downloaded from Arrow.com.Downloaded from Arrow.com.Downloaded from Arrow.com.Downloaded from Arrow.com.Downloaded from Arrow.com.Downloaded from Arrow.com.Downloaded from Arrow.com.Downloaded from Arrow.com.Downloaded from Arrow.com.Downloaded from Arrow.com.Downloaded from Arrow.com.Downloaded from Arrow.com.Downloaded from Arrow.com.Downloaded from Arrow.com.Downloaded from Arrow.com.Downloaded from Arrow.com.