Service menu
AirModule 6 720 813 268(2014/10)
48
compensate for the heating system's increased heating output capacity
in higher temperatures.
This calculation takes into account the adjusted outside temperature
and the room control temperature. The room control temperature
consists of the desired room temperature (set room temperature value)
and the room influence.
This way, the user can influence the heating curve directly by changing
the room temperature set value.
The most important settings are: system temperature, maximum flow
temperature, room temperature offset (parallel offset) and minimum
outside temperature.
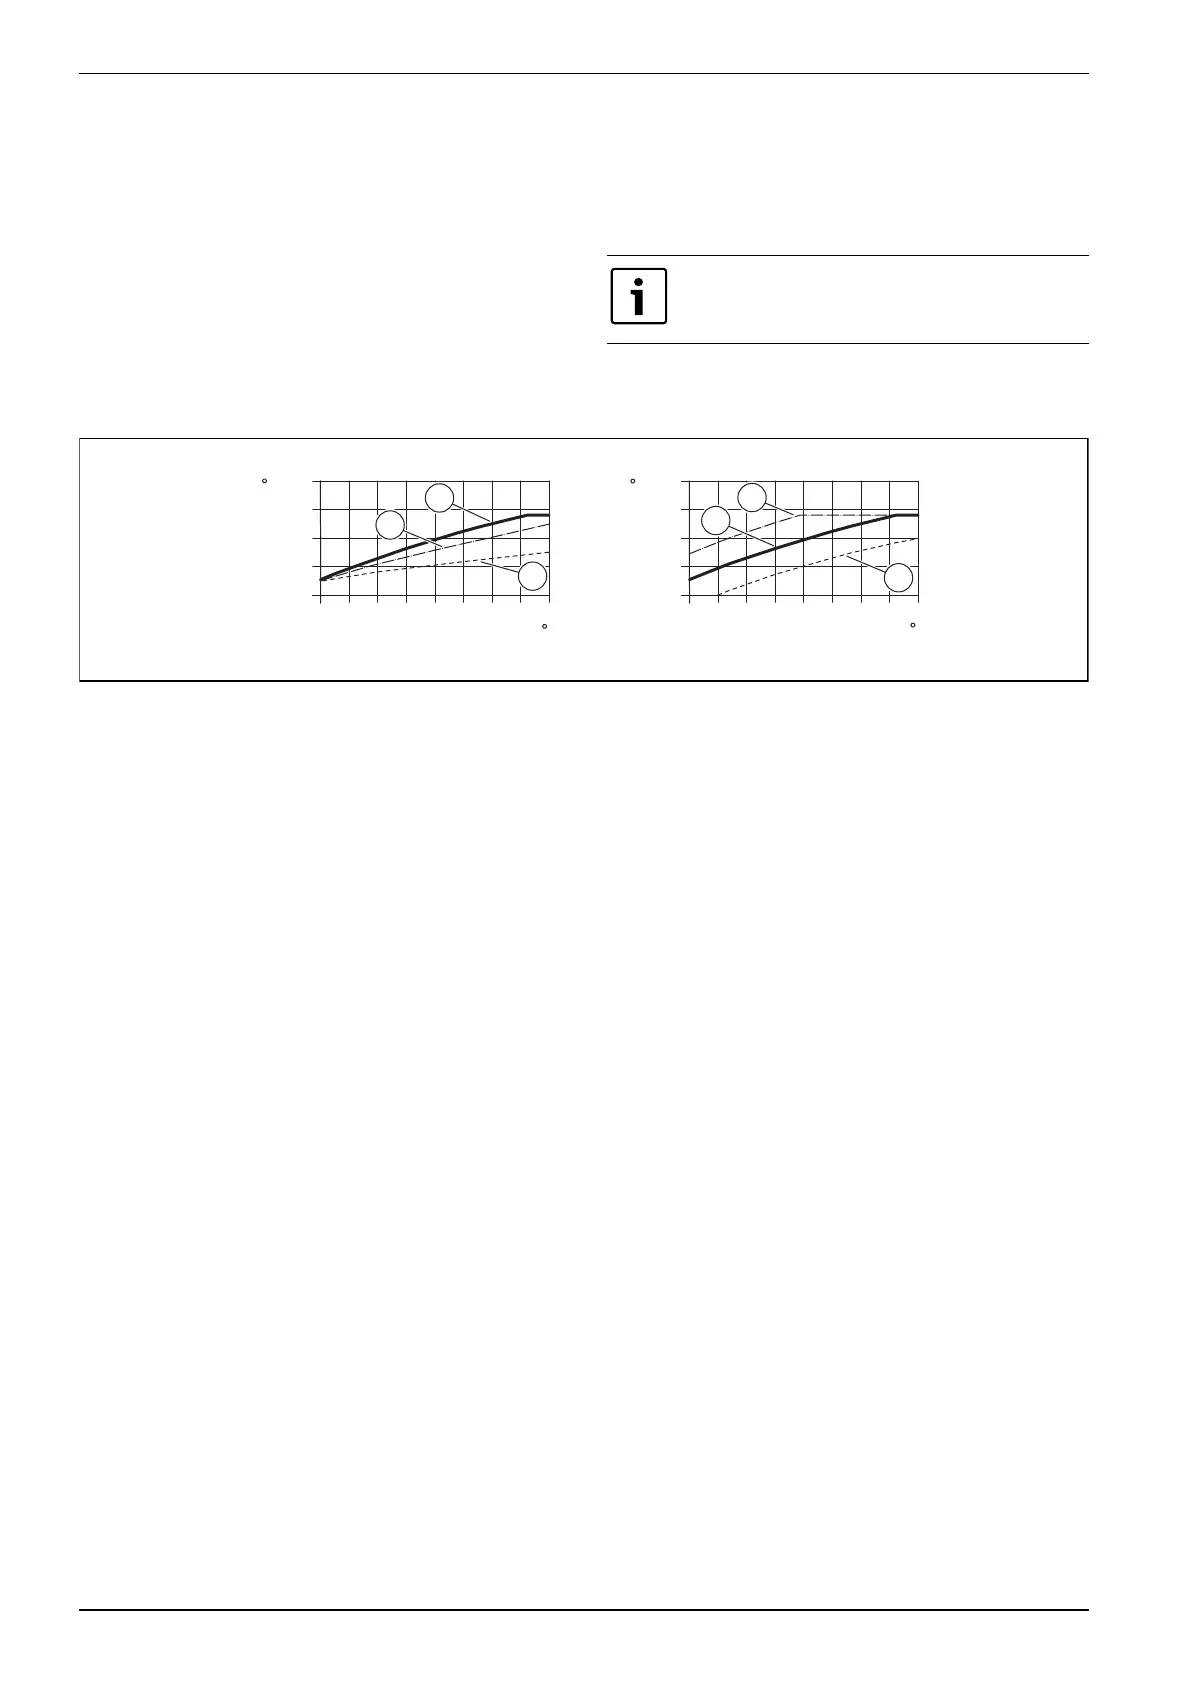
The heating curve ( fig. 40 and 41) is in principle determined by the
curve base and end points. At an outside temperature of 20 °C the base
point is 25 °C flow temperature. The heating curve end point must be set
according to the heating system´s system temperature.
Decisive to the course of the heating curve (slope/gradient) are the two
parameters minimum outside temperature ( page 44) and system
temperature (the flow temperature that should be reached at minimum
outside temperature) ( fig. 40 and 41, left).
The heating curve can also be parallel offset up or down ( fig. 40
and 41, right) by adjusting the room temperature offset parameter and/
or the set room temperature.
Fig. 40 Setting of Heating curve for underfloor heating systems/convectors
Left: increase with system temperature T
1
and minimum outside temperature T
1,min
Right: parallel offset with room temperature offset or desired temperature
T
1
Outside temperature
T
0
Flow temperature
[1] Setting: T
0
= 45 °C, T
1,min
= –10 °C (basic curve), Limit at T
0,max
= 48 °C
[2] Setting: T
0
= 40 °C, T
1,min
= –10 °C, Limit at T
0,max
= 48 °C
[3] Setting: T
0
= 35 °C, T
1,min
= –20 °C, Limit at T
0,max
= 48 °C
[4] Parallel offset of standard curve [1] by changing the offset +3 or
by increasing the desired room temperature, limit at T
0,max
=
48 °C
[5] Parallel offset of standard curve [1] by changing the offset -3 or
by decreasing the desired room temperature, limit at T
0,max
=
48 °C
The heating curve shown on the display represents the
range + 20 °C to the minimum outside temperature set in
System data.
0
+10
+20
-10
-20
T
1
20
30
40
50
60
T
0
T
1
T
0
C
C
0
+10
+20
-10
-20
20
30
40
50
60
C
6 720 810 158-29. 1I
C
1
2
3
1
4
5