2-28 Keysight M937xA PXIe Service Guide
Tests, Adjustments, and Troubleshooting
System Verification
2-
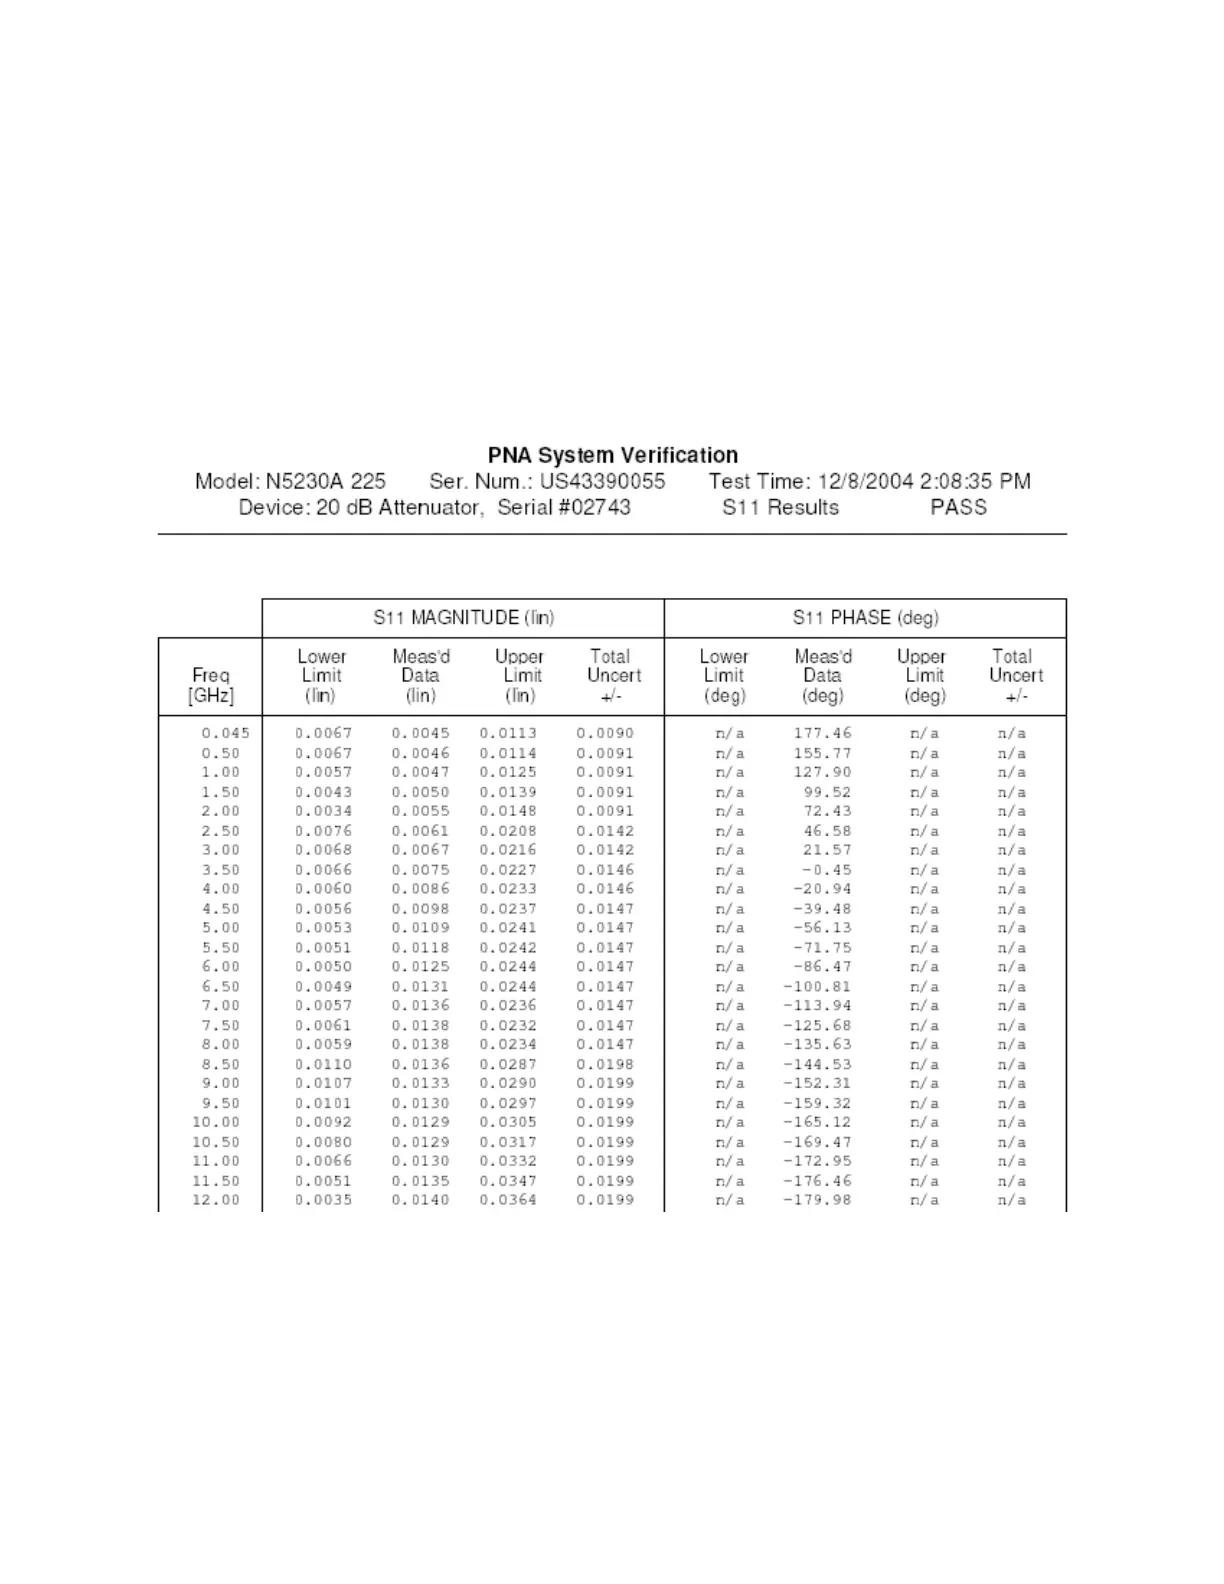
Interpreting the Verification Results
Figure 2-11 shows an example of typical verification results with Print Tabular
Data selected in the Output area of the System Verification dialog box.
At the top of the printed output is the name of the device, the serial number of
the device, and the date tested.
Each S-parameter measurement result is printed with frequency tested, lower
and upper limit lines, the measured data, and the result of the test.
Figure 2-11 Example of Printed Tabular Verification Results
Figure 2-12 shows an example of typical verification results with Print Graphs
selected in the Output area of the System Verification dialog box. The printed
graphical results show the following:
- the name of the device measured
- the serial number of the device
- the parameters measured

 Loading...