Spartan 821/721 Manual Display Overview 19
Time History Tab
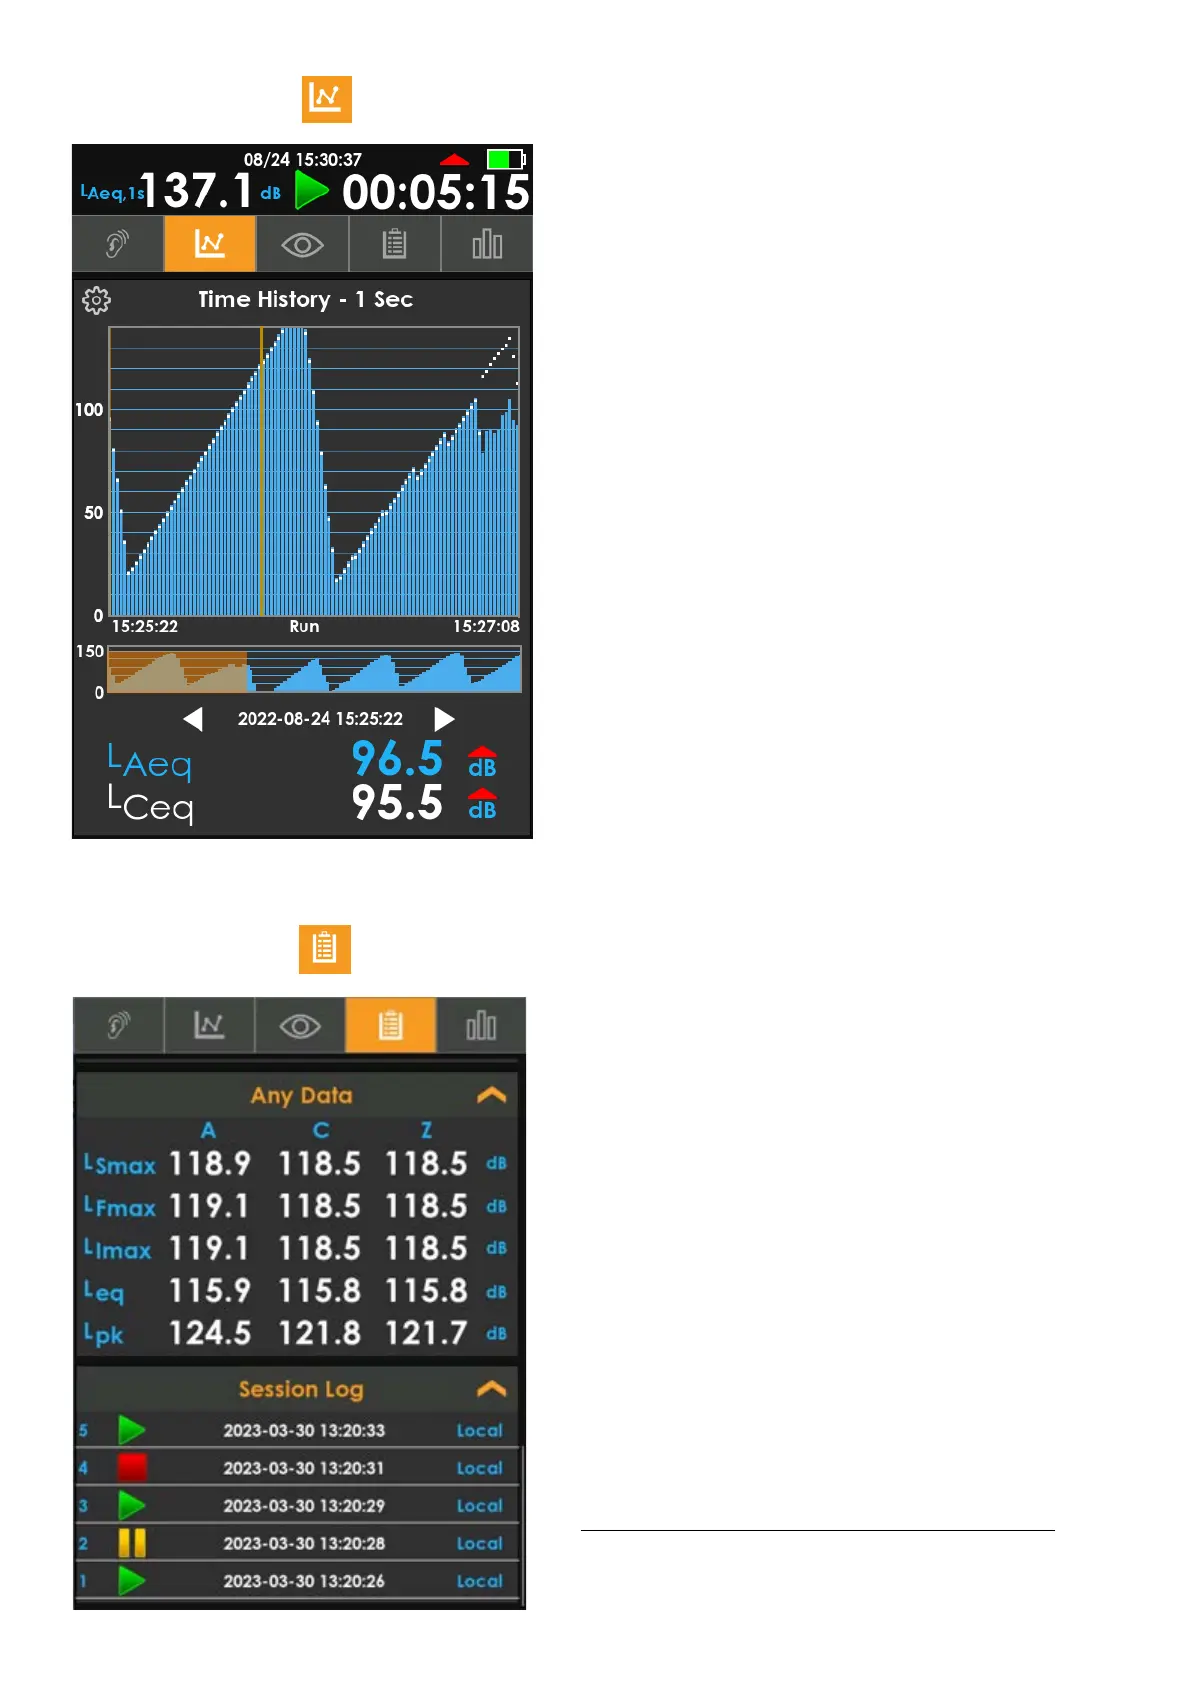
FIGURE 2-13 Time History
The Time History (TH) view displays customizable data from
the current measurement. The display updates once per
second regardless of the selected Time History period.
1. Near the bottom, two customizable metrics (L
Aeq
and
L
Ceq
) show levels for the currently highlighted record. You
can tap the metrics to change them.
2. The vertical gold indicator line in the graph shows the
currently highlighted time history record. The meter displays
the selected date and time with the two metrics’ values.
3. Use the left and right selector arrows to change the
highlighted record or tap on the graph to select a new record.
4. The gold highlight in the overall time history (the lower
graph) shows the position of the section in the upper graph.
Tap anywhere in the lower graph to navigate through the
data.
5. To edit the graph’s y-axis, tap the gear icon, then tap the
min or max value input to edit them. To accept and save, tap
outside the number keyboard when you have finished.
Overall Tab
FIGURE 2-14 Overall
The Overall tab is similar to the Live tab except the data
displayed is for the entire file. You can also find Session Log at
the bottom of the tab.
Overload Info Card
When an overload occurs on the meter, overload icons appear
throughout the system. The Overall screen indicates an
overload when the meter has been overloaded at any point
during the current measurement.
Community Noise Info Card
The Community Noise details provide two authoritative
exposure ratings for collected sources of sound (L
DEN
, L
DN
).
The ratings provide different calculations for exposure during
daytime, evening, or nighttime hours. For more information,
see Community Noise Equivalent Level (CNEL, LDEN)
.