29
HISTORY GRAPH
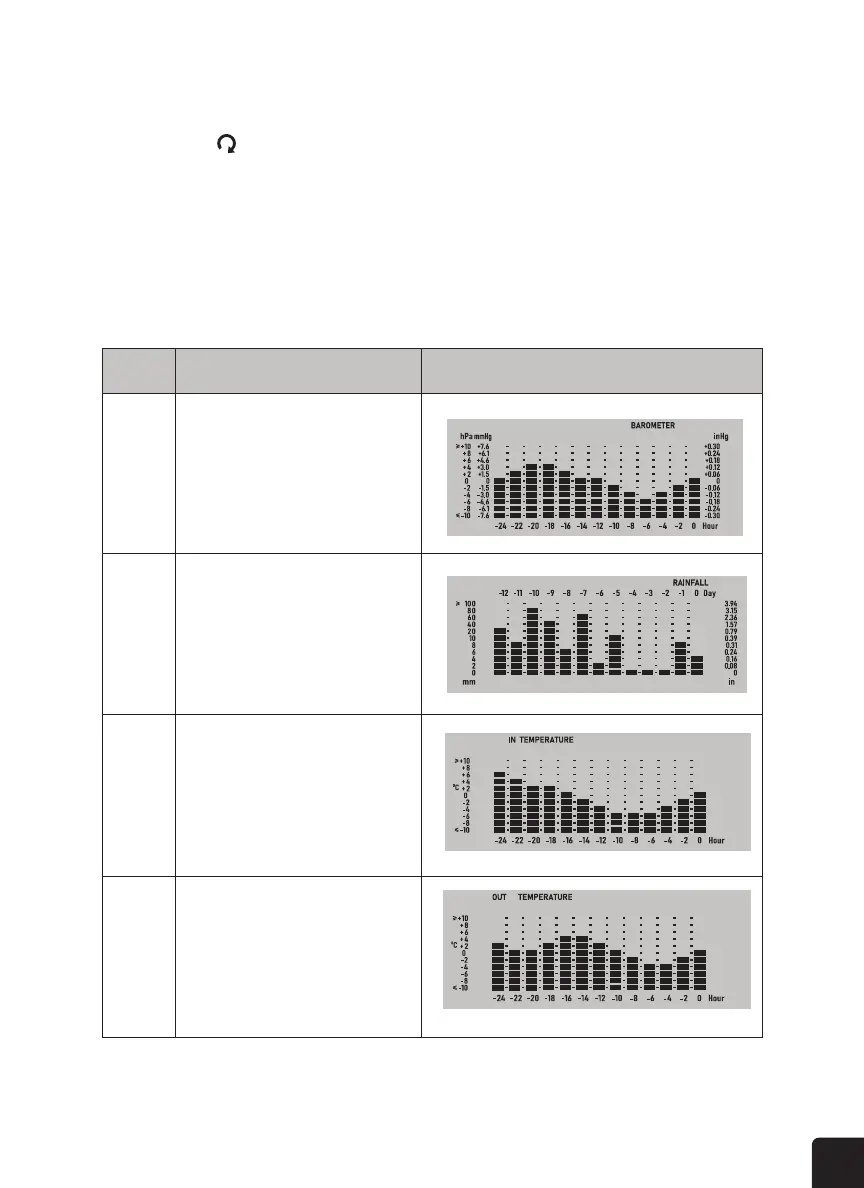
In normal mode, press the GRAPH button to check the history graph in following display sequence:
To activate the auto-loop function in this section, just press and hold the SKY button for two (2)
seconds and the icon will show near the CH number and display the connected channels’
reading at four (4) second intervals.
ACTIVATE THE AUTO LOOP FOR SKY CONDITION
Step Mode Display
1 Past 24 hours barometric pressure graph
2 Past 24 hours rainfall graph
3 Past 24 hours indoor temperature graph
4 Past 24 hours outdoor temperature graph
 Loading...