Quantity
(splayed at 1°)
W8L
Max dB spl
cont. pk
W8LC
Max dB spl
cont. pk
W8LM
Max dB spl
cont. pk
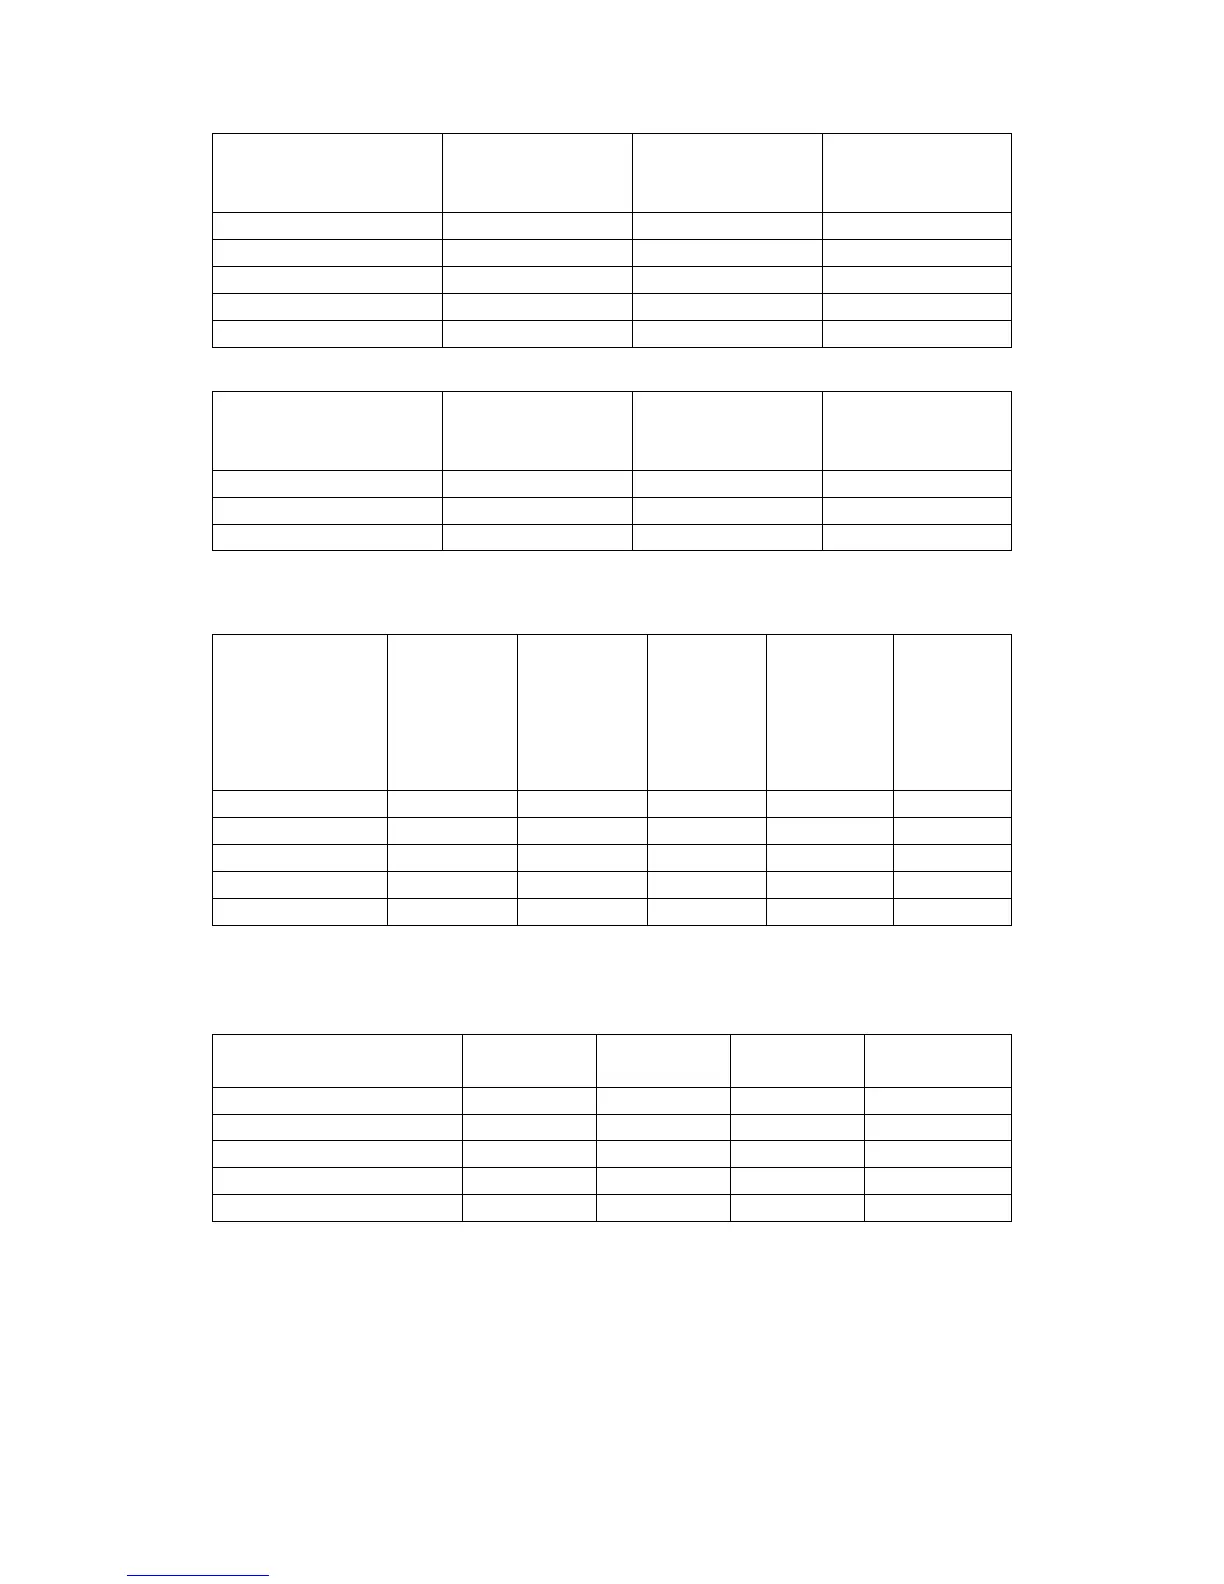
1 134 140 129 135 125 131
2 140 146 135 141 131 137
4 145 151 140 146 136 142
6 148 154 143 149 139 145
8 150 156 145 151 141 147
Effective source spl (referred to 1m) vs model & quantity
Quantity
(splayed at 2°)
W8L
Max dB spl
cont. pk
W8LC
Max dB spl
cont. pk
W8LM
Max dB spl
cont. pk
1 134 140 129 135 125 131
2 139 145 134 140 130 136
4 143 149 138 144 134 140
Effective source spl (referred to 1m) vs model & quantity
Value of B
Distance from
array
↓
1m
array
(2xW8L,
3xW8LC
or
4xW8LM)
2m
array
(4xW8L,
5xW8LC
or
8xW8LM)
4m
array
(8xW8L,
11xW8LC
or
16xW8M)
6m
array
(12xW8L
or
16xW8LC)
8m
array
(16xW8L)
16m 15dB 12dB 12dB 12dB 12dB
32m 21dB 15dB 15dB 15dB 15dB
64m 27dB 21dB 18dB 18dB 18dB
128m 33dB 27dB 21dB 21dB 21dB
256m 39dB 33dB 27dB 24dB 24dB
Radial attenuation vs line array length & distance at 6KHz
(inter-cabinet splay = 1° or less)
Value of C
Distance from array
↓
25% R.H.
50% R.H.
75% R.H.
100% R.H.
16m 2dB 1dB 0.7dB 0.6dB
32m 4dB 2dB 1.4dB 1.2dB
64m 8dB 4dB 2.8dB 2.3dB
128m 16dB 8dB 5.6dB 4.6dB
256m 32dB 16dB 11dB 9.2dB
Excess air attenuation vs distance at 6KHz (20°C at sea level)
Stereo Approximation
The above figures are for a single column. Centre-field maximum spl may increase by
approximately 3dB at mid frequencies for stereo systems and may approach a 6dB
increase at low frequencies.