DISPLAY
EN / SunMaster CS15TL/CS20TL / August 2010 21
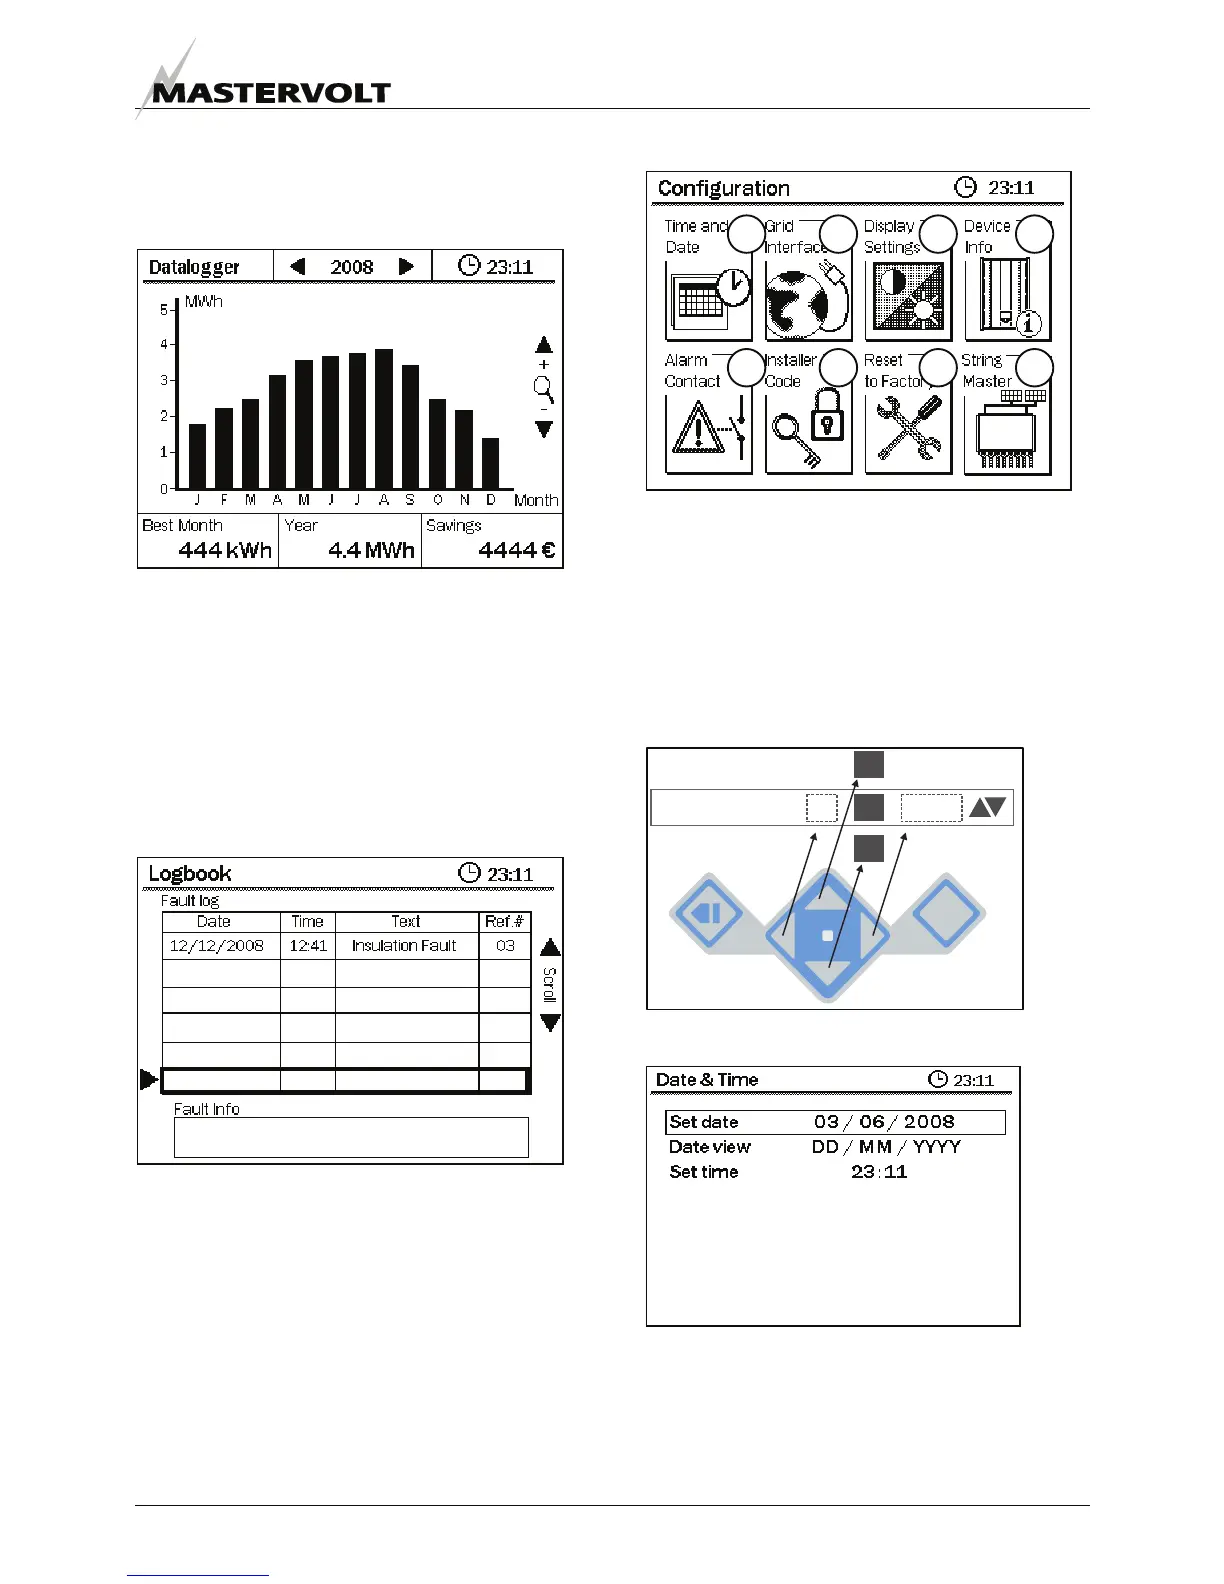
8.7 DATALOGGER
The Datalogger shows the solar (total) variables in a 2 axis
graphic. A day, month and year representation can be
selected by pressing the buttons Up and Down (figure 23,
button 3 and 7 respectively).
Figure 31: Datalogger, year representation.
The day (month, year) representation shows the energy
inverted that day (month, year), the savings in your
currency that day (month, year) and the best energy hour
(day, month). The resolution for the day (month, year)
representation is 15 minutes (1 day, 1 month).
8.8 LOG BOOK
The Log book shows all errors reported since installation
of the inverter. Scrolling is done by pressing the buttons
Up and Down (figure 23, button 3 and 7 respectively).
Figure 32: Log book use
8.9 CONFIGURATION
Figure 33: Configuration screen
See figure 33. The numbers 1 to 8 correspond with the
section numbers 8.10.1 to 8.10.8.
8.9.1 Date and time settings
For settings the LCD buttons are used like below.
Left and right are for scrolling, up and down for altering
values. OK opens the setting mode and confirms the
values after setting, Back exits the setting mode.
Figure 34: How to set values on the LCD screen
Figure 35: Date and time settings
1 2 3 4
5 6 7 8
OK
Set date
14 / / 201004
05
03