00110230w Rev 10/20 14 of 24
TIP
Pressing the Arrow buttons
to scroll through options
Edit Analysis
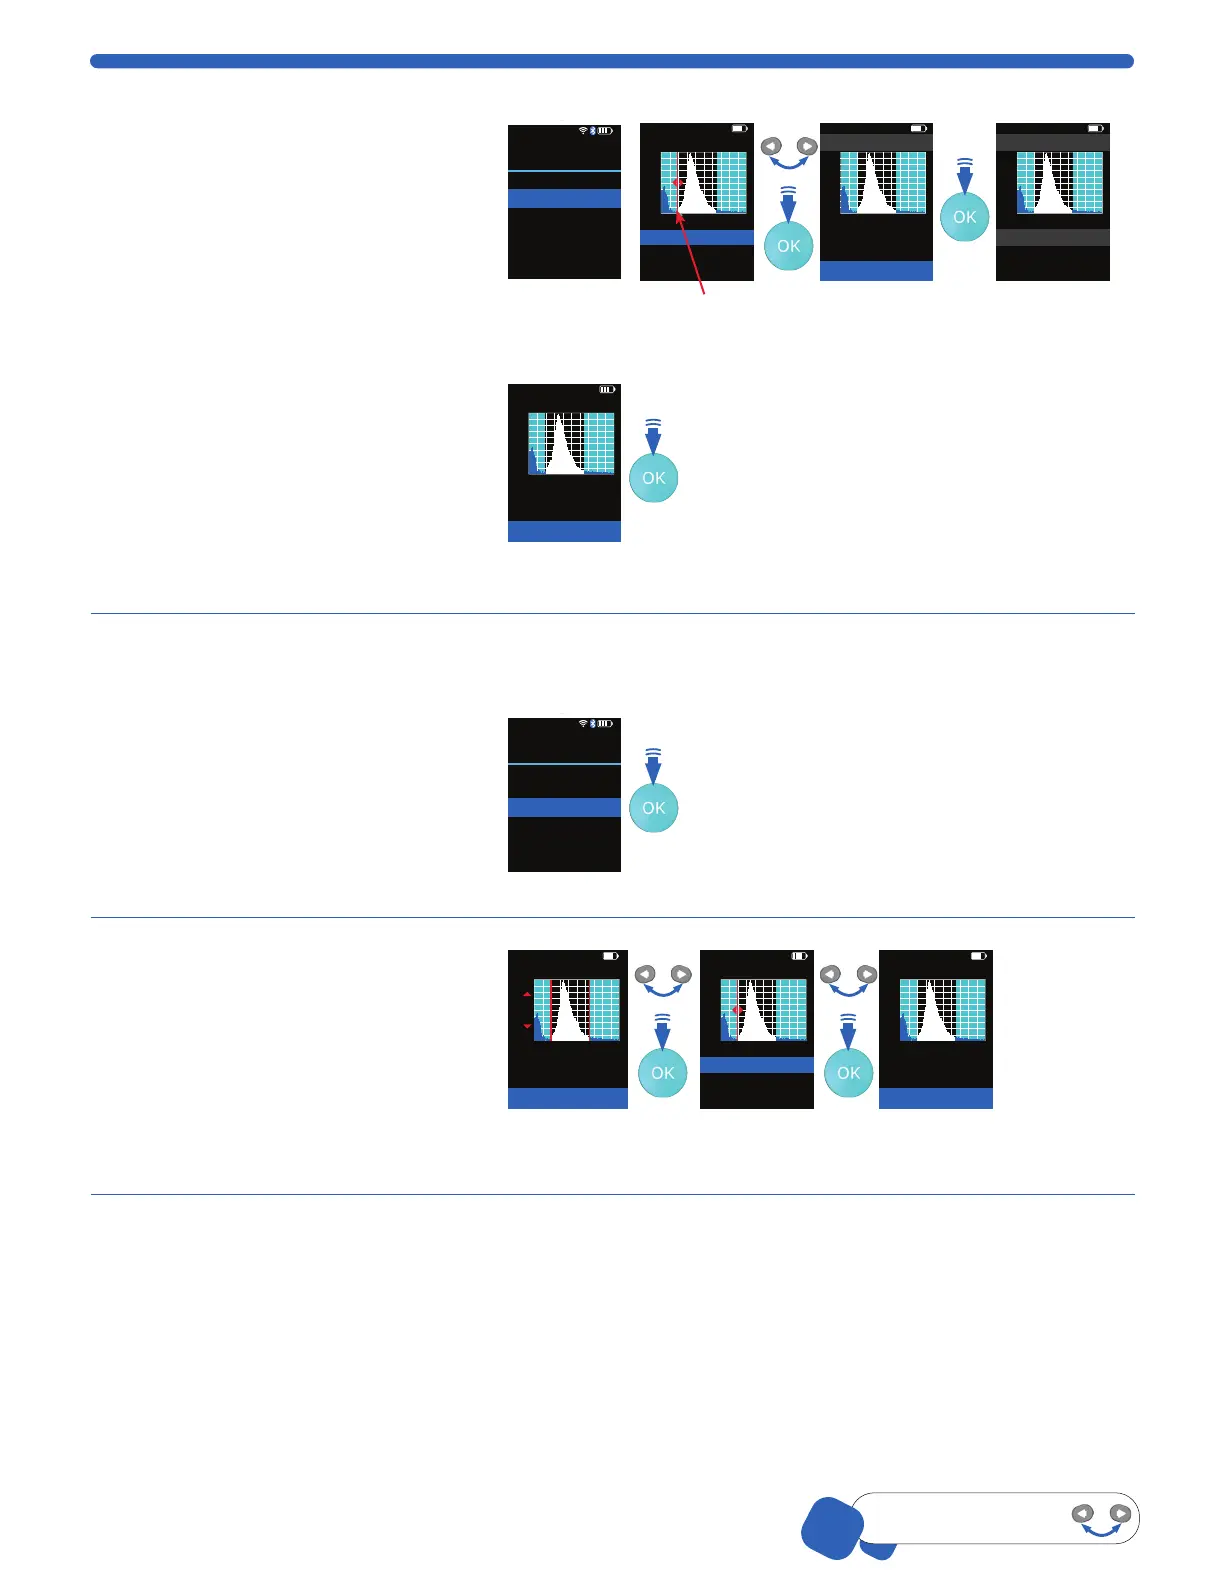
1. Select Histogram from the main menu
and scroll to Edit Analysis, press OK.
Low gate will be highlighted and a
flashing red line flanked by red arrows
shows on the histogram. Press the
OK button.
2. Increase or decrease the Low gate
number using the ARROW buttons.
Press the OK button to select. The
low gate will flash red on the
histogram again.
3. Scroll to advance to High Gate,
press the OK button.
4. Adjust the High Gate similarly by
using the ARROW buttons, press the
OK button.
5. Scroll down to Done and press the
OK button to return to the histogram.
01-Feb-18 14:16
Histogram
Back
Go to Home
Edit Analysis
Switch to Volume
Scale Y Axis Count
Export to USB
Print
<
<
01-Feb-18 14:16
Histogram: Edit Gates
High gate:
Done
26.575
Low gate: 12.585
Count
36
01-Feb-18 14:16
Histogram: Edit Gates
High gate:
Done
26.575
Low gate: 12.585
Count
36
01-Feb-18 14:16
Histogram
Test 3 03-Dec-17
Count
36
3.342e5
15.685
/mL
µm
Conc.
Dia.
01-Feb-18 14:16
Histogram: Edit Gates
High gate:
Done
26.575
Low gate: 12.585
Count
36
Switch to Volume / Diameter
This option switches the view between
volume and diameter (X-Axis) for the
current histogram only. Scroll to
Switch to _____.
From here, Scepter™ 3.0 automatically
takes you to Edit Analysis, p.13 to
adjust the gating.
01-Feb-18 14:16
Histogram
Back
Go to Home
Edit Analysis
Switch to Volume
Scale Y Axis Count
Export to USB
Print
<
<
Scale Y-Axis Count
1. Scroll to Scale Y-Axis Count, press
the OK button.
2. The count will appear as a red
line flanked by red arrows on the
histogram. Adjust by pressing the
ARROW buttons. Press the OK button.
Histogram: Scale Y Axis
Count
36
Press OK to accept
Set scale < >
Histogram: Edit Gates
High gate:
Done
26.575
Low gate: 12.585
Count
36
Histogram: Edit Gates
High gate:
Done
26.575
Low gate: 12.585
Count
36
When using the 40 µm sensor, the Y-Axis may need to be scaled and the gates may need
to be adjusted manually to see the desired peak.
FLASHING
900
900