NV30/NV40 Operations and Maintenance Manual Operating the transmitter
Page 2-40 Issue 3.3 2014-12-10
Viewing real-time meters
The AUI can be used to display metered parameters on the Home page (see Figure 2.30), if selected
individually from the
Meters List View page or saved in a meter list layout and set to default.
This section includes the following topics:
• Describing the meter display on page 2-40
• Accessing meter information on page 2-41
• Identifying meter information on a specific sub-device on page 2-42
• Saving a meter list on page 2-43
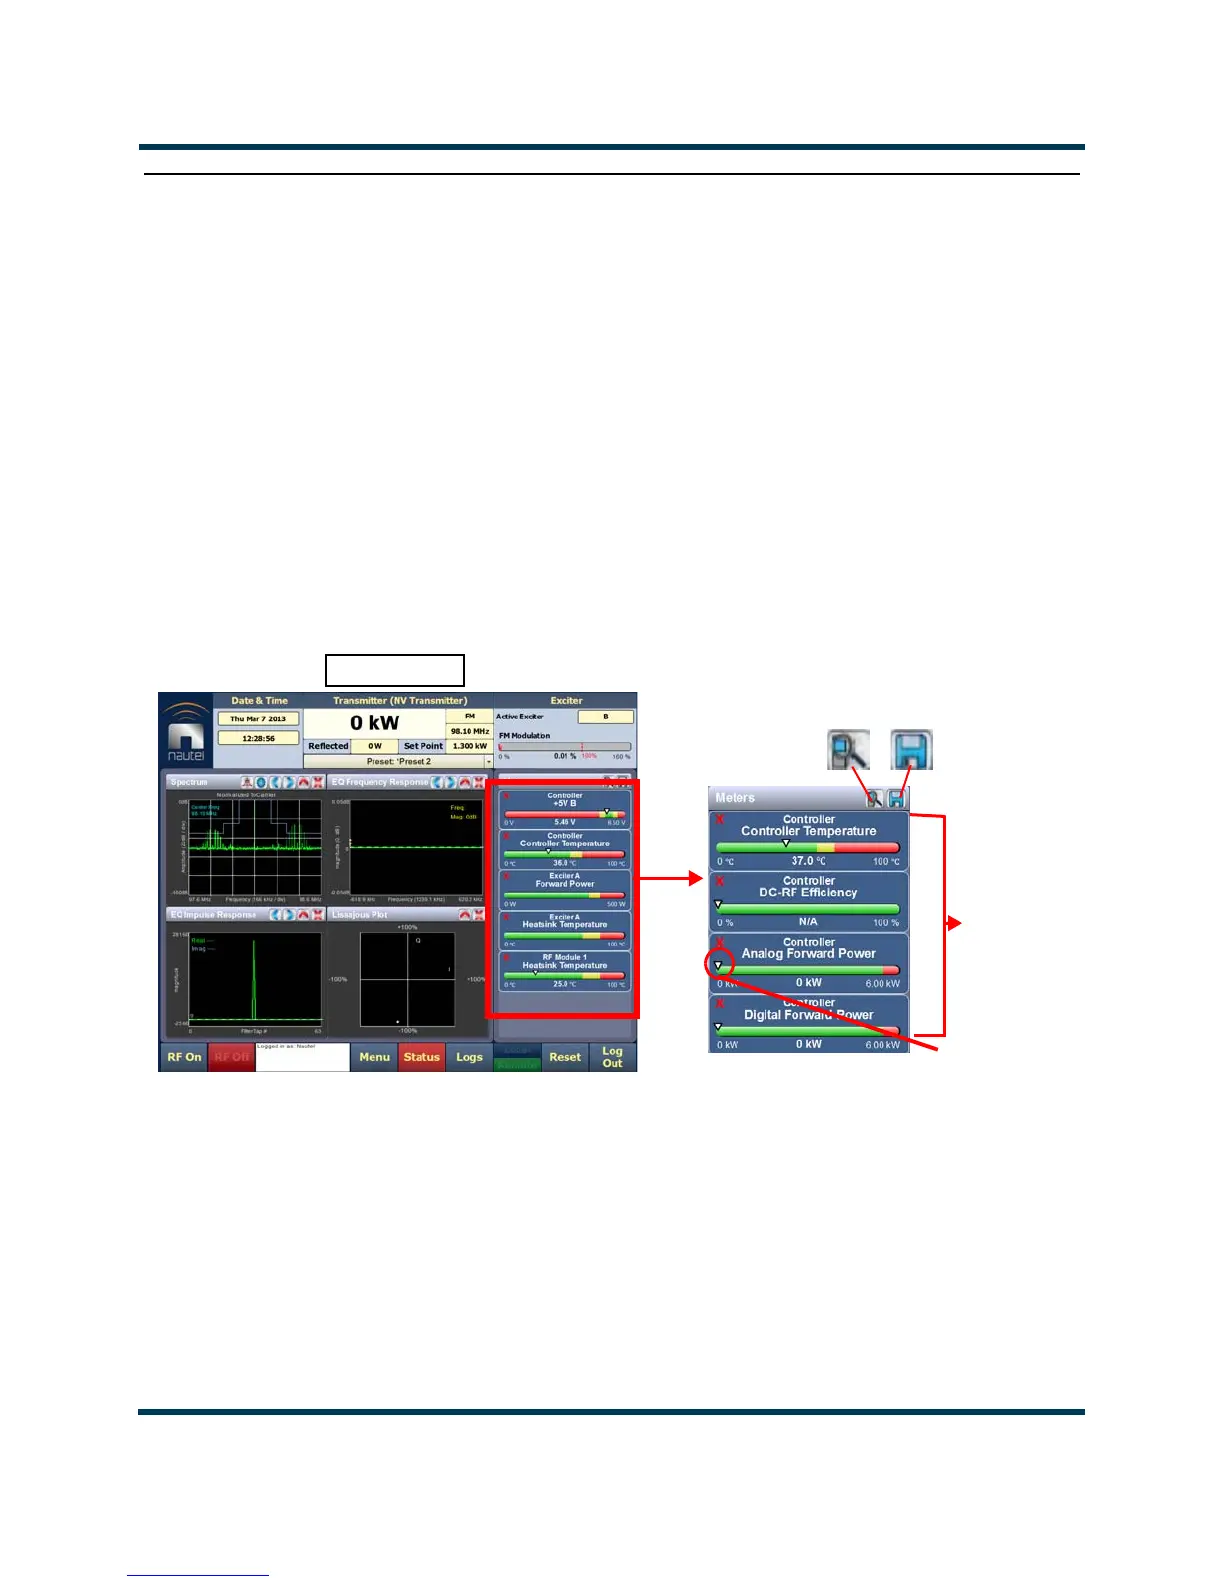
Figure 2.30: Meters Page
Describing the meter display
The meters displayed in the AUI represent the active meters selected for display. Each meter is a
colour-coded bar with minimum and maximum values (see Figure 2.30). The current value for a
meter is indicated by an arrow on the colour-coded bar, as well as a numeric value below the meter.
• A parameter value in the green section of a meter bar indicates the parameter is within
the range for normal operation.
HOME PAGE
Information
Selected
Meters
Buttons
View
Save
Arrow
 Loading...