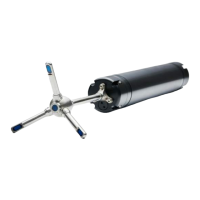
NORTEK VECTRINO VELOCIMETER
User Guide
19
Rev. C • 10.2004
on your beam geometry. The long-term bias in the Vectrino is typically a frac-
tion of 1 cm/s. The Vectrino software predicts errors based on the short-term
error of a single ping and the number of pings averaged together. The short-term
error of a single ping depends on the size of the transmit pulse and the measure-
ment vol ume, and it depends on the beam geometry. Averaging multiple pings
reduces errors according to the formula:
Vmean
=
Vping
N
in which is the standard deviation and N is the number pings you average
together.
Note: The Vectrino software predicts the instrumental error only. In many
situations, the environmental turbulence or surface waves will dominate the
short term velocity fl uctuations.
Data Handling
The Vectrino software creates binary fi les, which can be converted to ASCII
format fi les, using the Vectrino software.
• The *.hdr fi le is a self-documented table. Please note that this fi le contains the
detailed data format of all the other ASCII fi les.
• The *.dat fi les contains velocity and pressure data at the full sample rate.
• The *.sen fi les contains system data such as the time/date, compass, tilt, tem-
perature, battery voltage, etc. These data are sampled once per second.
You will fi nd the ASCII fi les easy to import into most spreadsheets and data
analysis programs. NORTEK recom mends the use of a specially developed pro-
gram for turbulent data analysis. The program is called
ExploreV. See Appendix
2 – Optional confi gurations and features for more on this.
Interpreting and Analyzing the Data
We strongly recommend the use of our internet pages to gain access to the latest
technical notes and user-experience regarding data analysis and related matters.
If the data looks different from what you expected and you have reason to be-
lieve that this is instrument or deployment related, consult Chapter 10 – Trou-
bleshooting before taking other actions.