1500 North Belcher Road, Clearwater, FL 33765 • Tel (727) 447-6140 • Fax (727) 442-5699 • sales@onicon.com
Turbine Flow Meter Manual 05/13 - 0721-1 / 13518 Page 22
4.2 INSERTION METER START-UP AND COMMISSIONING
Please read the entire procedure carefully before proceeding. Wiring diagrams are located in the
appendix A. A worksheet for checking off the following steps and recording measured values is
located on the following page.
1
Conrm meter location
and adequate straight
pipe run to achieve
desired results.
Is the meter located in the correct location as required by the plans?
Compare actual straight pipe upstream and downstream of the meter location to recommended distances
identied in the installation manual. Note that the manual is very conservative, assuming worst-case pipe
obstructions. Contact ONICON to discuss specics of your application. If straight pipe run is very short,
consult factory PRIOR to installing a single turbine meter to discuss possibility of upgrade to a dual turbine
meter.
2 Conrm pipe size.
Conrm that the meter is tagged for the pipe size in which it is installed. When in doubt, measure the
circumference of the pipe. Pipe O.D. = (circumference / 3.14) – (insulation thickness x 2)
3
Conrm insertion depth
and orientation.
Each ow meter comes with an attached insertion gage and instruction tag. Ensure the meter is inserted to
the correct depth and that the electronics enclosure is parallel with the pipe, with the arrow in the direction
of ow.
4
Conrm control system
programming.
Conrm that the control system input point is properly congured for the analog range (or digital pulse
factor) identied on the ow meter calibration tag & certicate
5
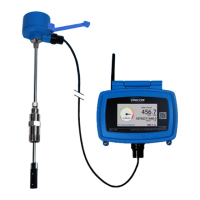
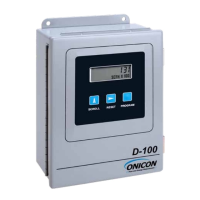
Conrm connection
to correct ONICON
display or BTU Meter
(if ordered).
Conrm that the ow meter serial number matches the ONICON display or BTU meter serial number (when
ordered together).
6
Verify wiring before
connecting power.
Prior to connecting the power, verify that the wiring is correct as shown in this manual (and/or with the
additional wiring diagram provided with ONICON display or BTU meter.) If in doubt, call ONICON for
assistance before proceeding further.
7
Conrm correct supply
voltage.
Verify that 24 (+/- 4) V is available. Serial Numbers 115692 and later can accept 24 V DC or AC, but earlier
meters required 24 VDC. Note: ONICON display module or BTU meter provide 24 VDC to the ow meter.
ONICON display modules and BTU meters are typically powered by 120 VAC; however, low voltage versions
are also available.
8 Connect power. Wait approximately 45 seconds after power-on before proceeding further.
The following steps require ow in the pipe. Flow signal readings should be taken while holding the ow rate constant if possible;
otherwise, take the various output readings as quickly as possible.
9
Measure and
record frequency
output(s):
The average frequency output signal is a 0-15 VDC pulsed output ranging up to 500 Hz and must be
measured with a frequency counter or oscilloscope. Measure DC frequency (Hz) from GREEN(+) to
BLACK(-). Also measure DC volts on same wires. Five to seven VDC is normal for a spinning turbine, 0 or
14+ VDC indicates a stopped turbine. (A reading of 1 to 4 VDC could indicate a problem)
GPM = Frequency in Hz X 60
Meter Factor in ppg (refer to calibration tag for meter factor)
For dual turbine models, also measure and record the top and bottom turbine signals.
TOP: WHITE(+) to BLACK(-) BOTTOM: ORANGE(+) to BLACK(-)
10
Measure and record
analog or digital
outputs.
Current Output:
Voltage (0-10V) Output:
Divided Output:
Scaled Output:
Refer to ow meter wiring diagram for wire colors for the various outputs available based on your particular
ow meter model. Use the following formulas to calculate ow rate from measured analog signals:
GPM = (measured current in mA - 4) X Full Scale Analog Flow Rate
16
GPM = measured DC volts X Full Scale Analog Flow Rate
10
Same calculation as step 9, except use “divided meter factor” (measure and record frequency)
Each contact closure = unit volume identied as “Scale Factor” (measure and record time interval between
contact closures.)
11
Compare various
output signals to each
other and to the ow
rate displayed by the
control system.
The top and bottom turbine frequencies (dual) should ideally be within about 20% of each other and their
average should equal the average frequency output.
Compare the ow rates calculated in STEPS 9 and 10 to each other and to the ow rate indicated by the
control system. Refer to troubleshooting guide when readings are inconsistent.
End of standard start-up and commissioning. Please contact ONICON at (727) 447-6140 with any questions.