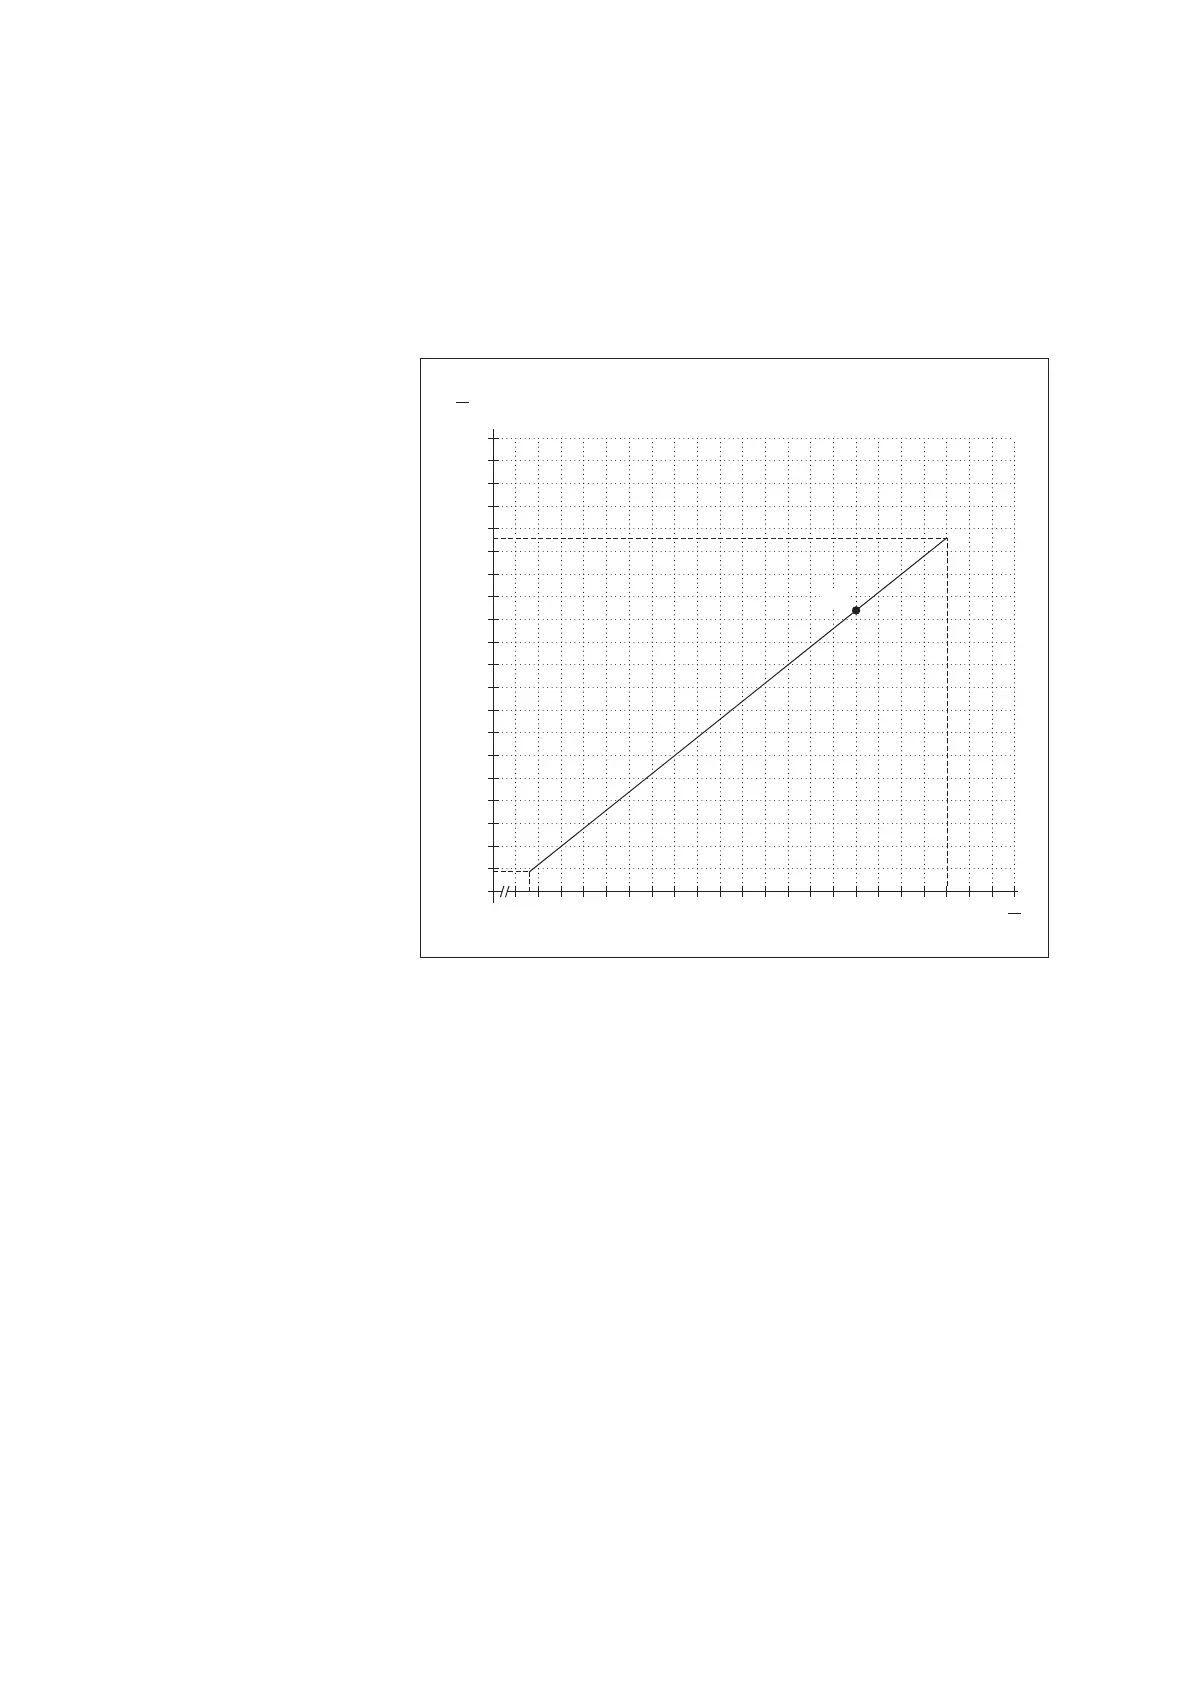
䡵 See the following diagram for the maximum load resistance applicable to your
power supply. Alternatively, the maximum load resistance can be calculated
according to the formula:
R
load (max)
= (U
supply
– 8.5 V)/0.025 A
Example: Power supply 24 Volt ➝ max. load resistance 620 Ohm.
The OTT PLS delivers a loop current corresponding to the measured value for a
l
oad resistance of up to 620 Ohm.
䡵 Dimension the connected electrical circuit accordingly. Check the input resis-
tance of the connected peripheral device for this purpose.
5.8 Note on using the 4 … 20 mA interface
䊳
Behavior when switching on the 4 … 20 mA interface
After providing the supply voltage, it takes approx. 7 seconds for the loop current
to take on the value proportional to the water level. (In the first 7 seconds, the
loop current is between 3 and 4 mA.) Afterwards, the pressure probe updates
the loop current every 2 seconds.
䊳
Loop current when configuring the 4 … 20 mA interface
If there is a communication via the RS-485 interface, the loop current is higher
than the appropriate level for the measured value by several mA. After the end
of the communication, it takes approx. 250 ms until the loop current takes on
the appropriate value again.
5.9 Note on using the RS-485 interface
The RS-485 interface is designed and tested for use with OTT dataloggers.
In this case, the transmission protocol via the physical RS-485 interface is the
SDI-12 protocol
. Connecting OTT PLS via the RS-485 interface to the OTT netDL/
OTT DuoSens ➝ see Appendix A, Method B.
OTT provides no guarantee of functionality if you connect the OTT PLS to the
data logger of a third-party manufacturer via the RS-485 interface!
10
15
20
25
30
U
V
100
0
200
300
400
500
600
700
800
R
Ω
900
1000
Example
Fig. 6: Diagram to determine the
maximum load resistance as a
function of the power supply.
Minimum power supply: 9.6 V
Maximum power supply: 28 V
Burden tolerance: 0.1 %/15 ppm.
(Burden = load resistor).
12