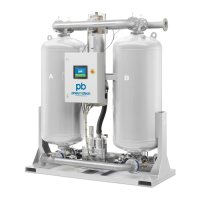
When the Chart (Medium Resolution) display is selected, a chart with an X-axis covering 4 hours is
displayed. The value displayed on the Y-axis depends on the selection made in the input screen. Each chart
dot represents a 1 minute average value.
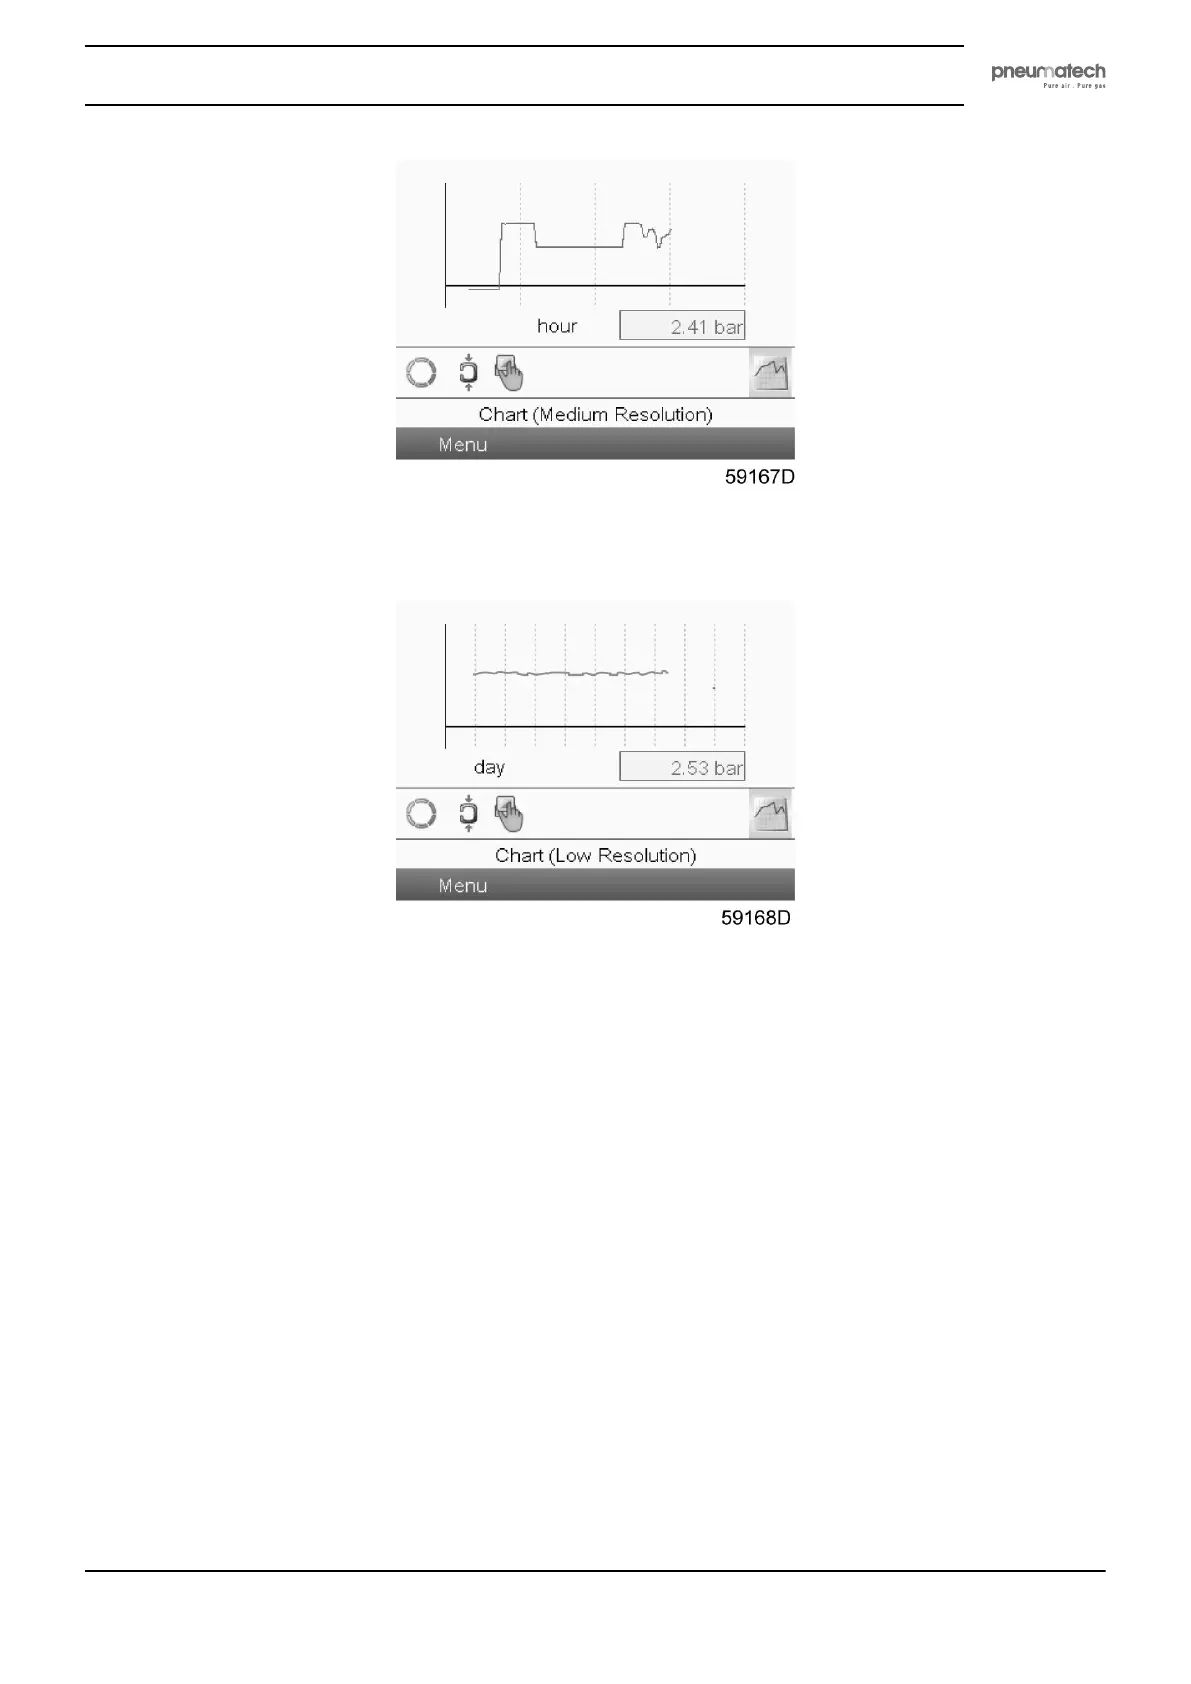
When the Chart (Low Resolution) display is selected, a chart with an X-axis covering 10 days is displayed.
The value displayed on the Y-axis depends on the selection made in the input screen. Each chart dot
represents a 1 hour average value.
4.5 Controller menu structure
Main menu
Press the Enter key to go to the main menu screen that is shown below.
Instruction book
2920 1891 00 23