PQR
Series Model D52
Page 53
www.Powertronics.com
V2.1
PQR 1010
User - Friendly
Multi Channel - AC Voltage, DC Voltage, Current,
Humidity and Temperature
Disturbance Recorder and Voltage Logger
Easy to Understand Reports
Simple connection to a Computer or Terminal
Made in USA
The PQR1010 Power Quality Recorder is a state of the art, fully
integrated instrument which measures, records, and reports power
disturbances, aiding in the analysis of power quality in medical,
commercial and industrial applications.
Disturbances detected on multiple channels are recorded by their
time, date, magnitude, and duration in a non-volatile RAM memory.
This data is then retrieved from the analyzer through its’ serial
communications port.
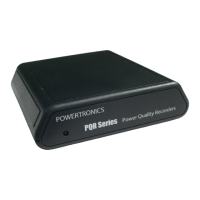
Connections to the PQR-1010 are made between the safety
connectors on the back of the unit, and the circuit panel to be tested.
The power to operate the unit comes from any standard 110v / 220v
AC outlet. Once plugged in, the PQR-1010 immediately begins
testing the signals on the input connectors.
Features
Measures all types of disturbances
* Spikes * AC Voltage
* Sags * Common Mode Noise
* Line Frequency * High Frequency Noise
* Dropouts * Power Failures
* Surges * Data Logging
Simple to operate:
1) Connect the test leads to a service panel
2) Plug the power cord into a grounded outlet
3) Periodically connect to a computer for reports
Stores events in non-volatile FLASH RAM
* 32,000 Event Storage
* Stores the average reading every minute
for up to 20 days on each channel
The PQR 1010 is one of a series of practical
power line monitors, designed and priced to
be outfitted to everyone who services or
installs electrical, and electronic equipment.
In addition to full Text Detail and Summary
reports, event information such as the
Magnitude, Time, and Date of each of the
disturbances is also reported.
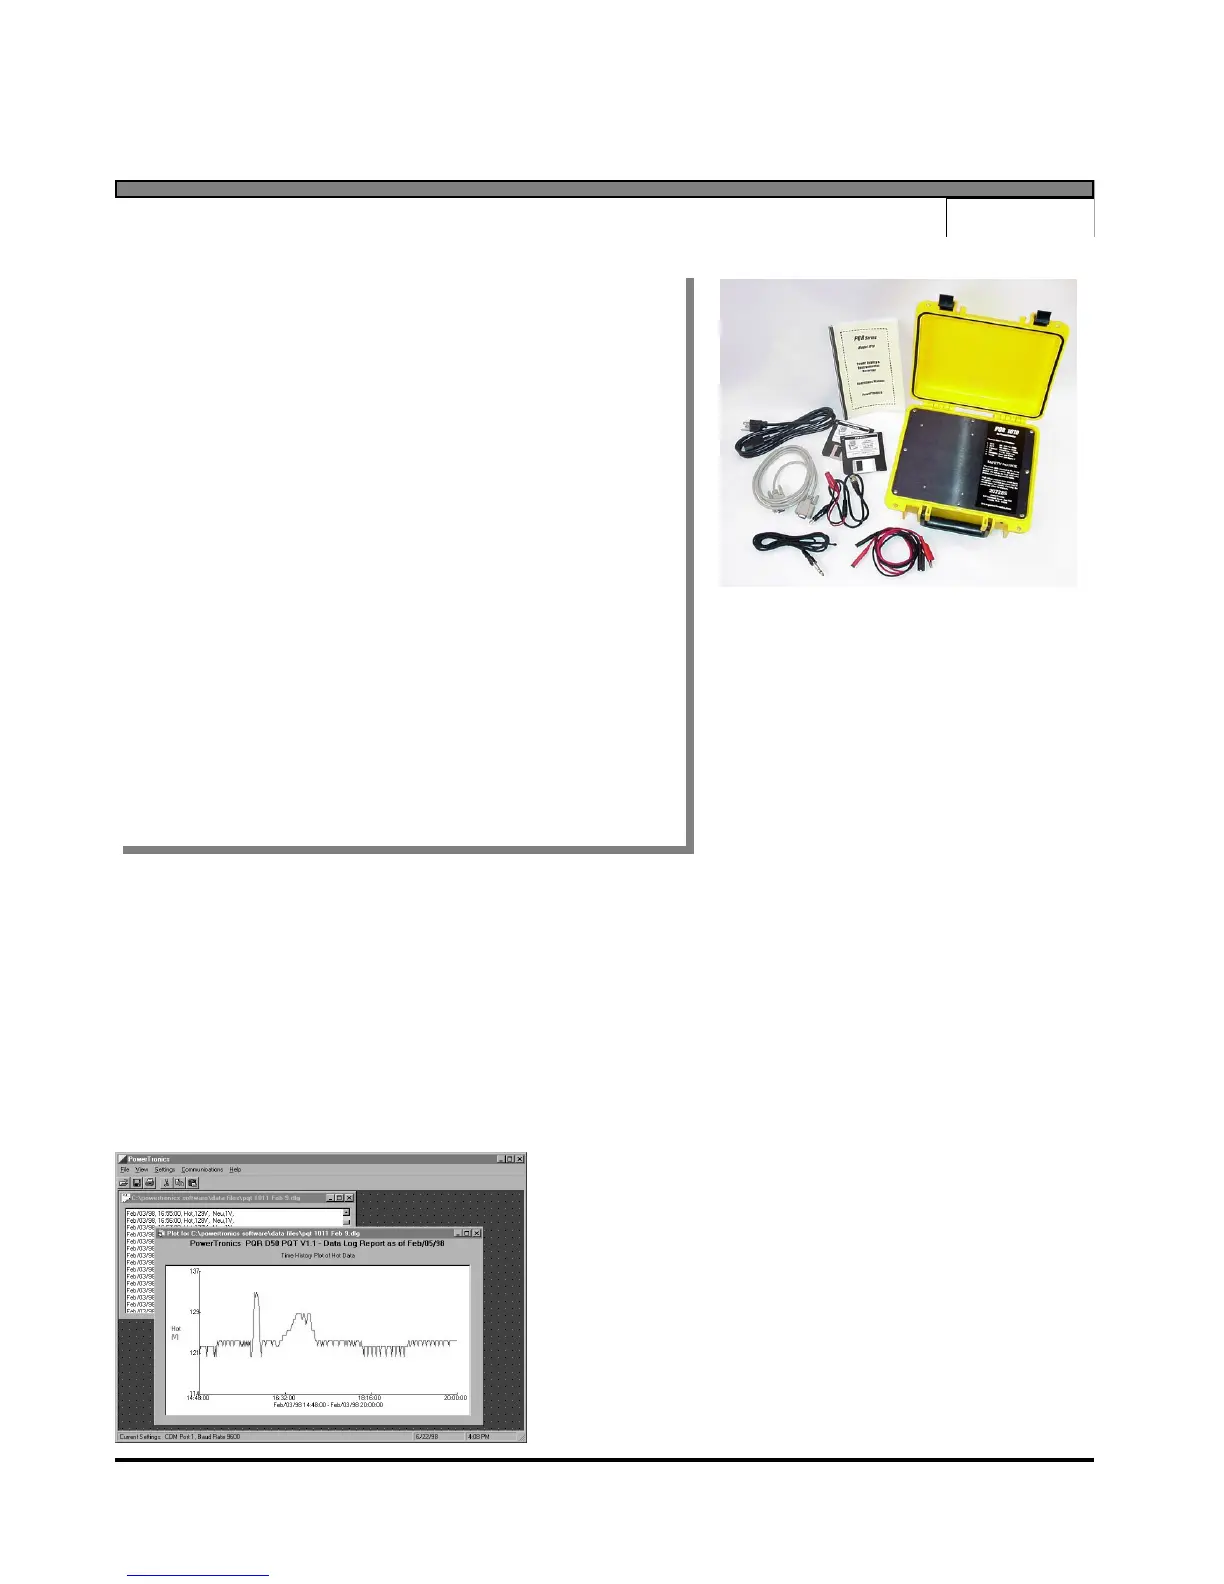
GRAPHICS SOFTWARE
INCLUDED!
Provided with the PQR 1010 is the PQR
HOST COMMUNICATIONS Software.
This software allows you to easily download
the data and display or print the DATALOG
chart over time, the PIE CHART of the
summary of events or the HISTOGRAM of
the detail of events.
 Loading...