© 2016 Proceq SA 11
3.2.2 Measurement Views
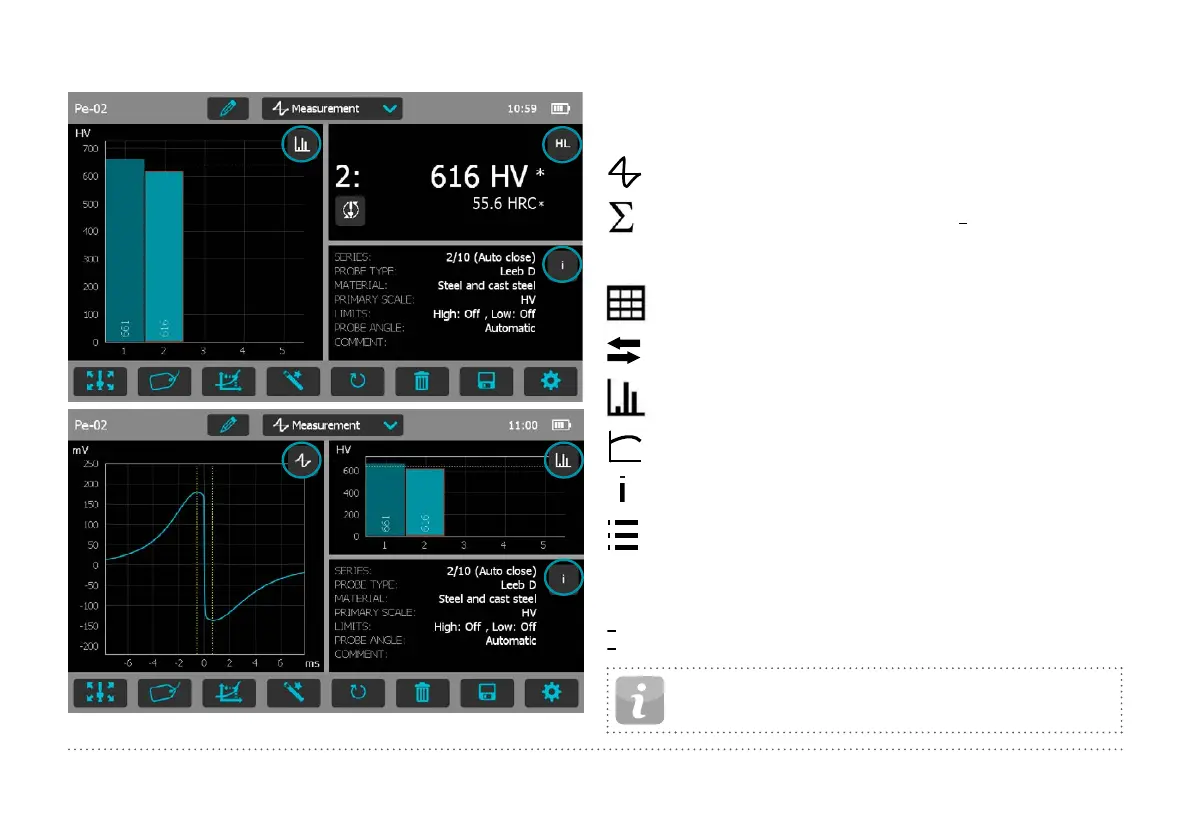
Figure 9: Measurement Views
Equotip 550 is fully customizable as a device and can display three dif-
ferent measurement views simultaneously. Each view can be switched to
meet the user’s requirements by simply clicking on the icon related to the
particular display at the top right corner of each screen.
Signal View: Display the probe signal from the last active
measurement. This may be useful for advanced evaluations.
Statistic View: View statistics for the active measurement se-
ries. Number of impacts (n), Average (
x
), Standard deviation
(σ), Minimum/Maximum () and Range () are displayed in the
primary scale.
Table View: Display the measurements for the active series in
a table format.
Conversion View: Display the actual value on the conversion
curve.
Bar View: Display the measurements of the series as a histo-
gram.
Profile View: Display the measurement results as a profile.
Info: Display the measurement settings e.g. series length,
probe type, material group etc.
User’s View: The user can choose between probe angle, mini-
mum, maximum, range and probe type for the field contents. To
change, tap on each individual box.
Single Record View: Display the last or selected measurement
result in both the primary and secondary hardness scales.
Sample ID’s: Defines the custom field.
NOTE! Screen views cannot be duplicated.
 Loading...