Trying Out the Instrument
R&S
®
RTO2000
65Getting Started 1332.9719.02 ─ 10
8. Tap "OK". Close the dialog box.
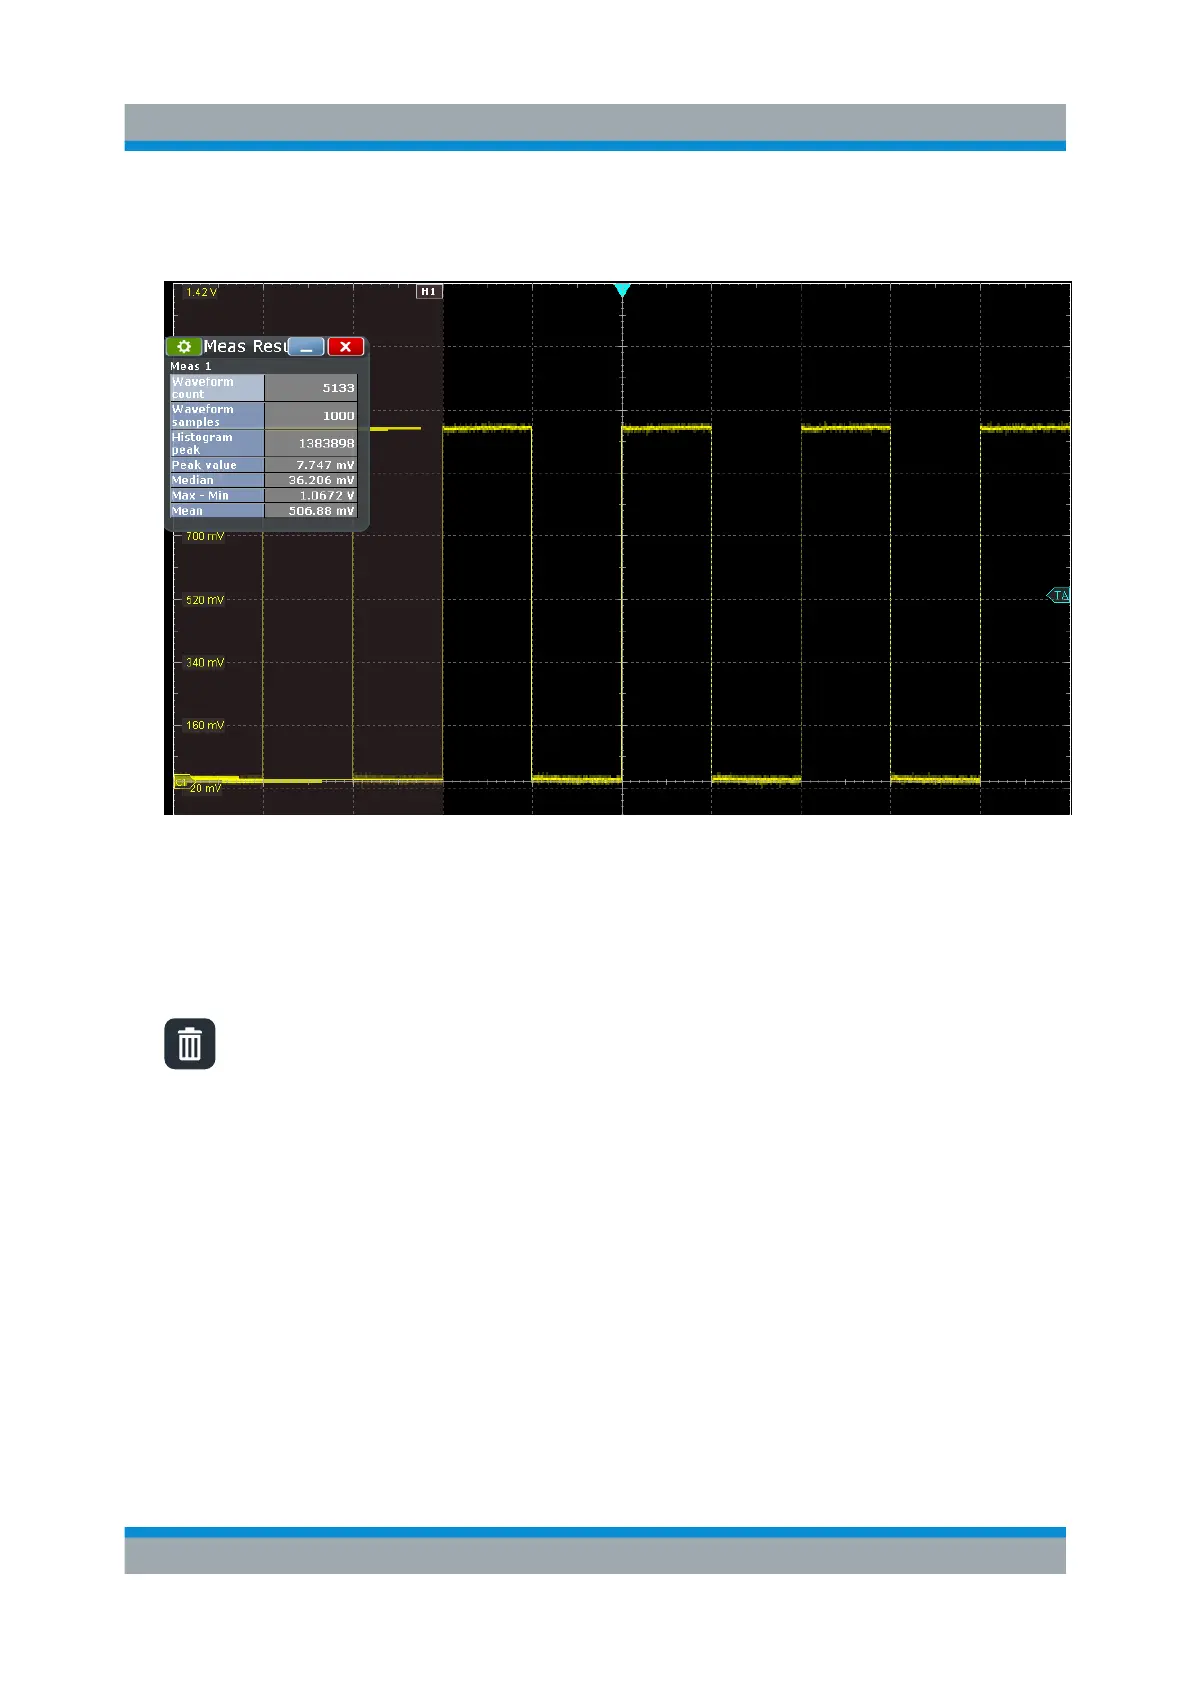
The histogram measurement results are displayed in the result box.
Tip: Alternatively to steps 5 to 8, you can double-tap the measurement
results, and select the appropriate measurement group and the measure-
ments in the sidebar.
9. To remove the histogram, tap the "Delete" icon on the toolbar, and then tap
the histogram.
The histogram and any measurements based on that histogram are deactiva-
ted.
6.8 Performing a Basic FFT Analysis
During FFT analysis, a signal in the time domain is converted to a spectrum of
frequencies. A basic spectrum waveform can be displayed quickly.
1. Restore the default signal channel settings by pressing the [Autoset] key.
2. Tap the "FFT" icon on the toolbar. Then tap the diagram.
Performing a Basic FFT Analysis
 Loading...