18
4.3 Tabular display
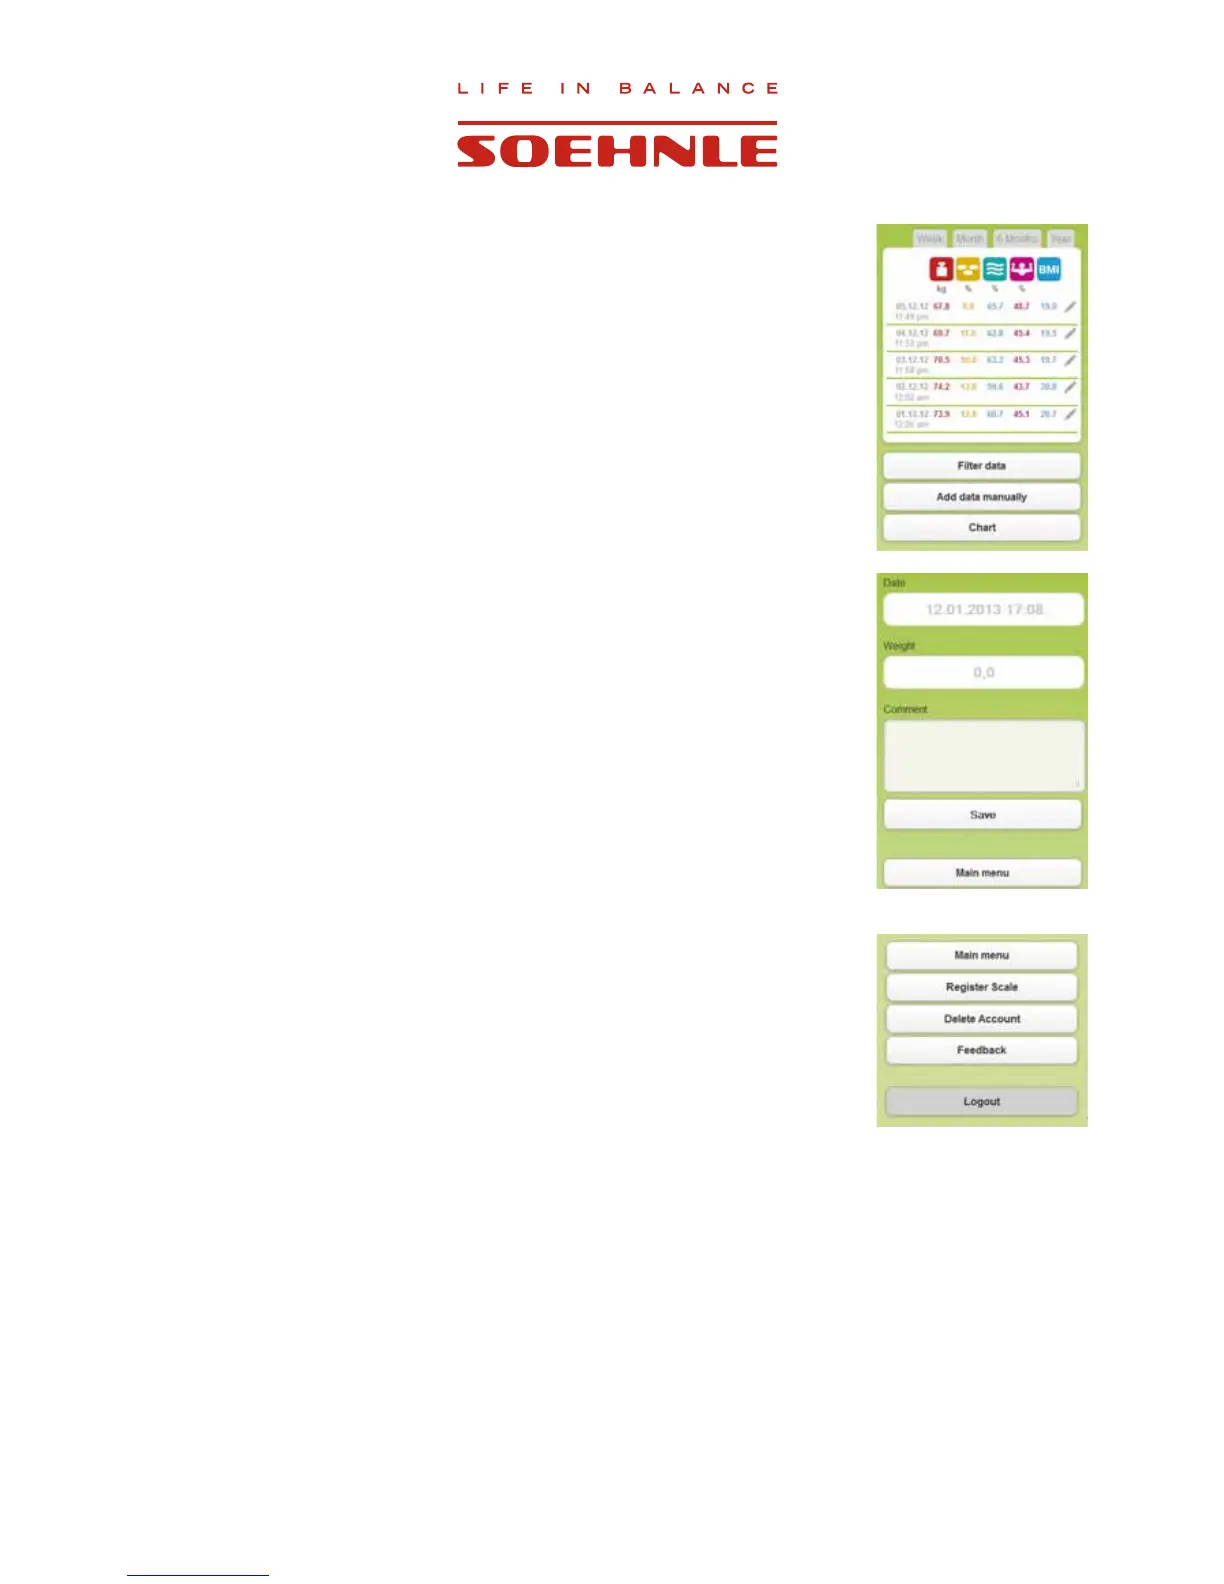
Go to ”Table”.
Select the period for review (week, month, 6 months, year, or customized
via ”Filter data”) for which the values are to be displayed.
If you tap on
next to an individual value, you can edit this data or
add a comment.
Use ”Add data manually” to add weight values and comments without using
the scale.
5. Feedback
8VH´0\SUR¿OHIHHGEDFN´WRVHQGXVUHPDUNVUHJDUGLQJWKLVSURJUDPRUWKH
product.
6. Deleting Account
8VH³0\SUR¿OHGHOHWHDFFRXQW´WRGHOHWH\RXUSHUVRQDODFFRXQW
All data will be irretrievably deleted after a security query and the
FRUUHVSRQGLQJFRQ¿UPDWLRQ