14 PCM
+
Operation Manual
The PCM
+
Receiver compensates for depth changes
during current measurements, and current readings
remain constant even when the depth of the pipeline
changes.
When a fault is encountered the current quickly drops.
A fault will result from coating damage, contacts with
other services, etc.
The loss of PCM
+
current will be virtually proportional
to the amount of CP current being used at the fault.
NOTE: Linear current loss may naturally occur along
the pipeline due to the age of the pipe and coating
conditions.
4.7 Using dBmA for Pipeline
Current Mapping
The PCM
+
Receiver displays current as mA, and when
results are saved to the internal datalogger, both mA and
dBmA are stored in memory.
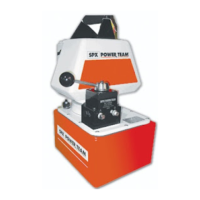
The AC signal current applied to a coated pipeline
in perfect condition will be lost by capacitance as
distance increases from the point where the signal is
applied. The PCM
+
uses near DC signal (4Hz) for current
measurement, so capacitive losses are minimal. The
resulting graph drawn using mA will have an exponential
slope, because there is a greater current loss rate close
to the transmitter.
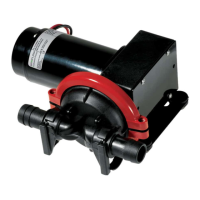
Converting the exponential mA result to logarithmic
dBmA will show the same graph as a straight line slope.
Displaying the results using dBmA loss per distance
has the advantage that the resulting graph is easier
to analyse.
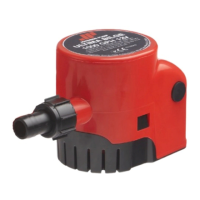
Example
There was a coated pipeline which had three defects of
equal electrical resistance, one near the beginning, the
next in the middle and one at the end. If the current loss
graph is prepared using mA on the vertical scale the
second and third faults would be shown as progressively
smaller steps in the graph. This is due to Ohms law, and
the loss of current at the previous fault.
Using dBmA as the vertical scale would result in equal
steps in the graph for equal size faults, regardless of how
much current was lost at the rst fault.
The graphs below show three equal faults and the effects
on a graph showing mA and dBmA.
Note that the graph showing mA (Figure 4.8) at rst
glance suggests that the faults are of diminishing
magnitude. The graph showing dBmA clearly shows the
magnitude of the faults are equal. Therefore dBmA shows
the ratio of the faults, whereas mA alone may give rise to
misinterpretation of data due to the high current loss near
the transmitter and lower losses further away.
Distance
mA dBmA A/mA
Figure 4.6: mA fault graph
Distance
Figure 4.7: dBmA fault graph
Figure 4.8: mA fault graph
Distance