PCM
+
Operation Manual 15
dBmA
Distance
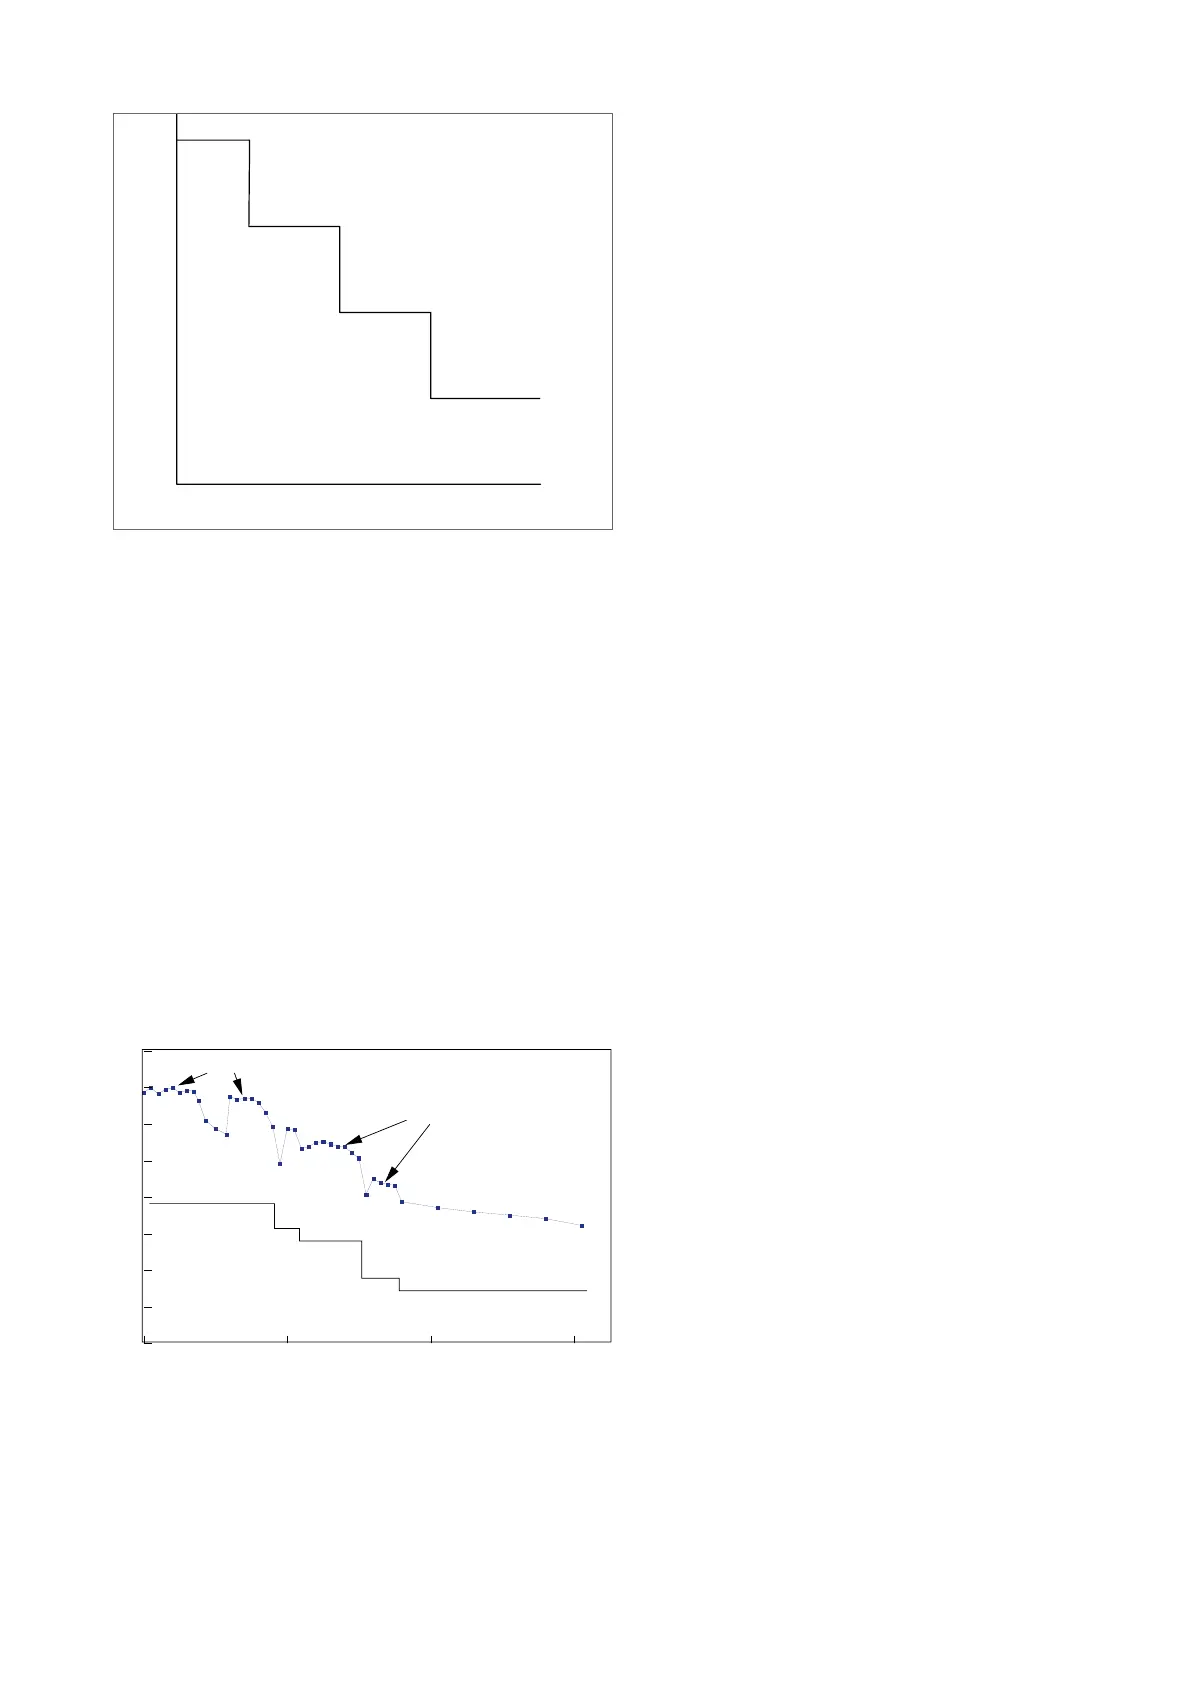
Figure 4.9: dBmA fault graph
In gure 4.10, the line marked ‘A’ to ‘E’ is the data
collected, whilst the line ‘1’ to ‘4’ is the interpreted data.
Note that at position ‘A’ the current falls and then returns
to almost its original level. This is probably due to eld
distortion of the locate signal possibly caused by another
utility line above the pipeline and should be ignored or
further investigation undertaken.
Steps ‘B’ to ‘E’ show denite steps (with some eld
distortion at the point of fault) and loss of signal. Note
the recovered reading is less than the signal before the
trouble.
Further investigations using the PCM
+
A-Frame should
now be undertaken so as to pinpoint the exact position
of the faults.
Figure 4.10: Collected data and interpreted results
0 200 400 600
46
48
50
52
54
56
58
60
62
Distance
A
B
C
D
1
2
3
4
E
Same level
Different levels