DocID026958 Rev 1 13/16
AN4594 Using the Sensors_Datalog application
16
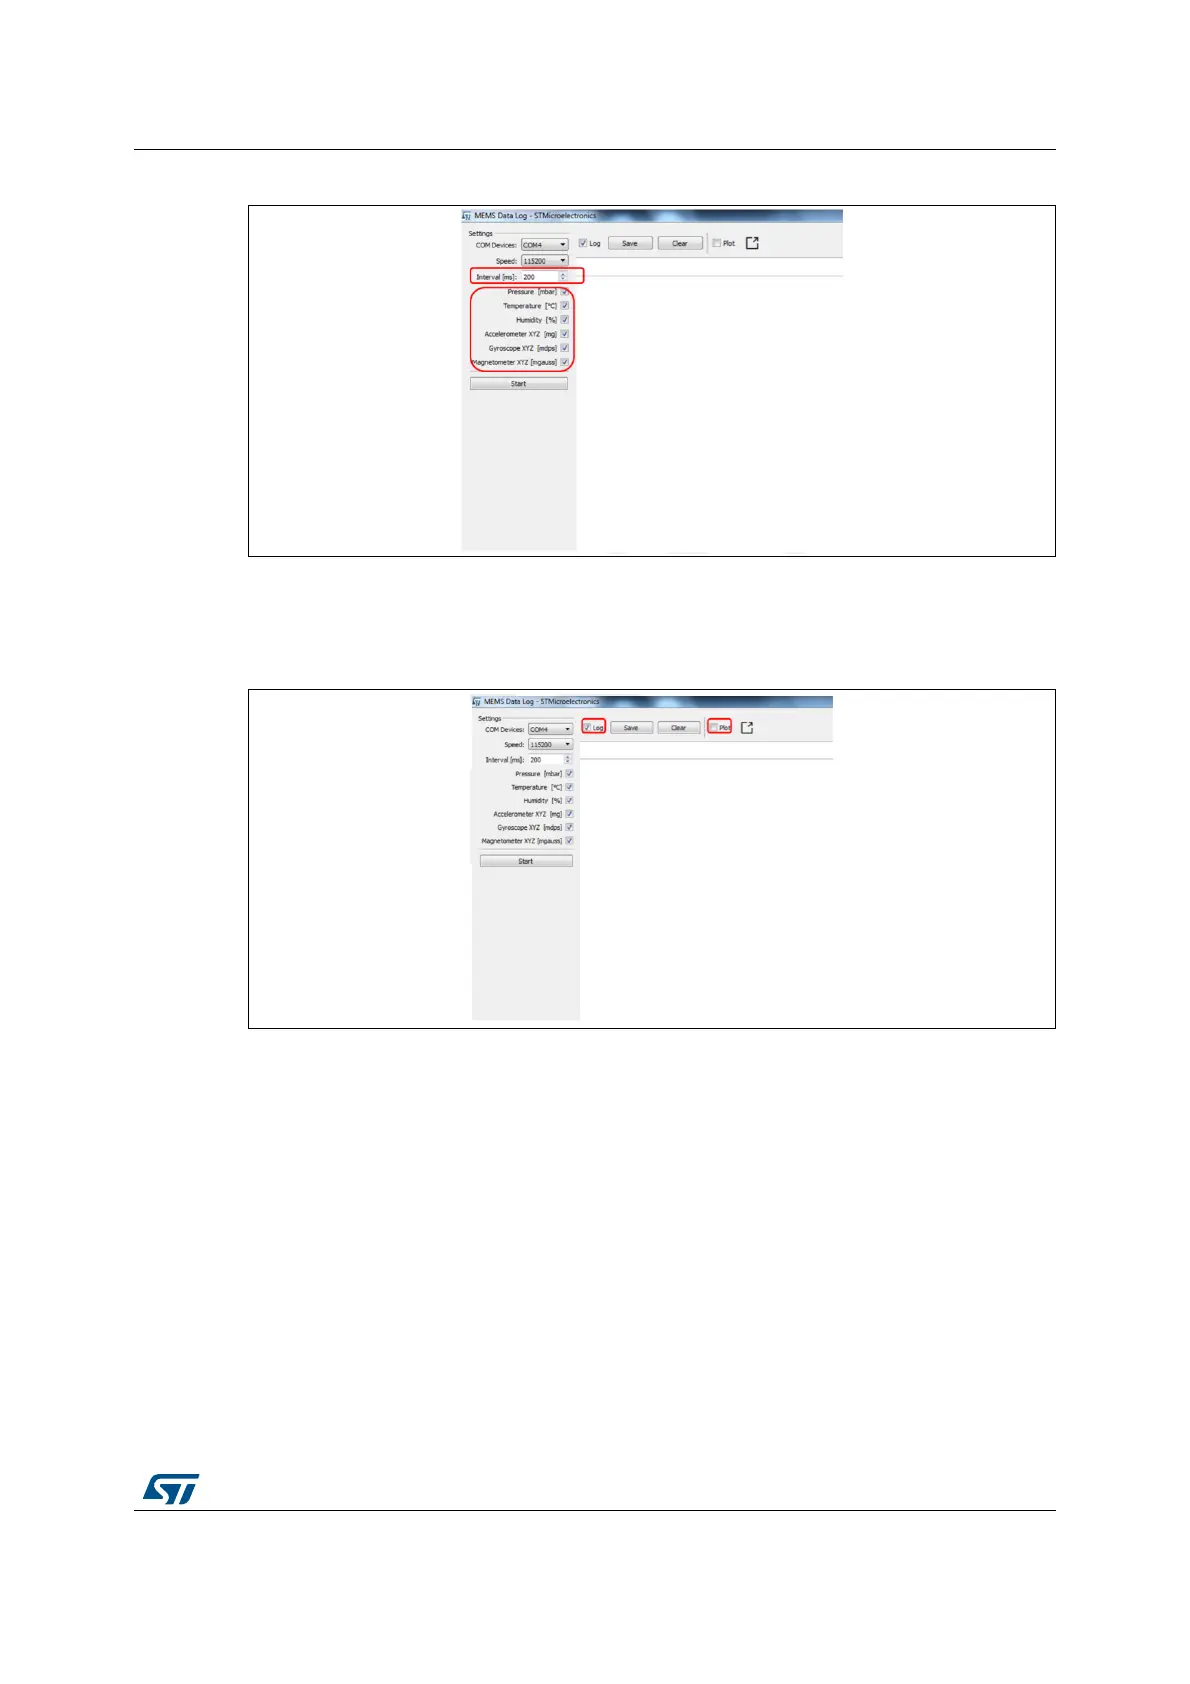
Figure 7. Sampling interval selection
5. You can save the log to a file that you can find in a folder called “SensorsDataLog”; or
you can clear the log by pressing the “ClearLog” button.
6. Check the “Plot” CheckBox to see a data log for the sensors that you have selected.
Figure 8. Log and plot selection
7. Press Start, and the data is displayed as shown in Figure 8
 Loading...