7.3.2 Information
The information shown on the display is described below using illustrative examples.
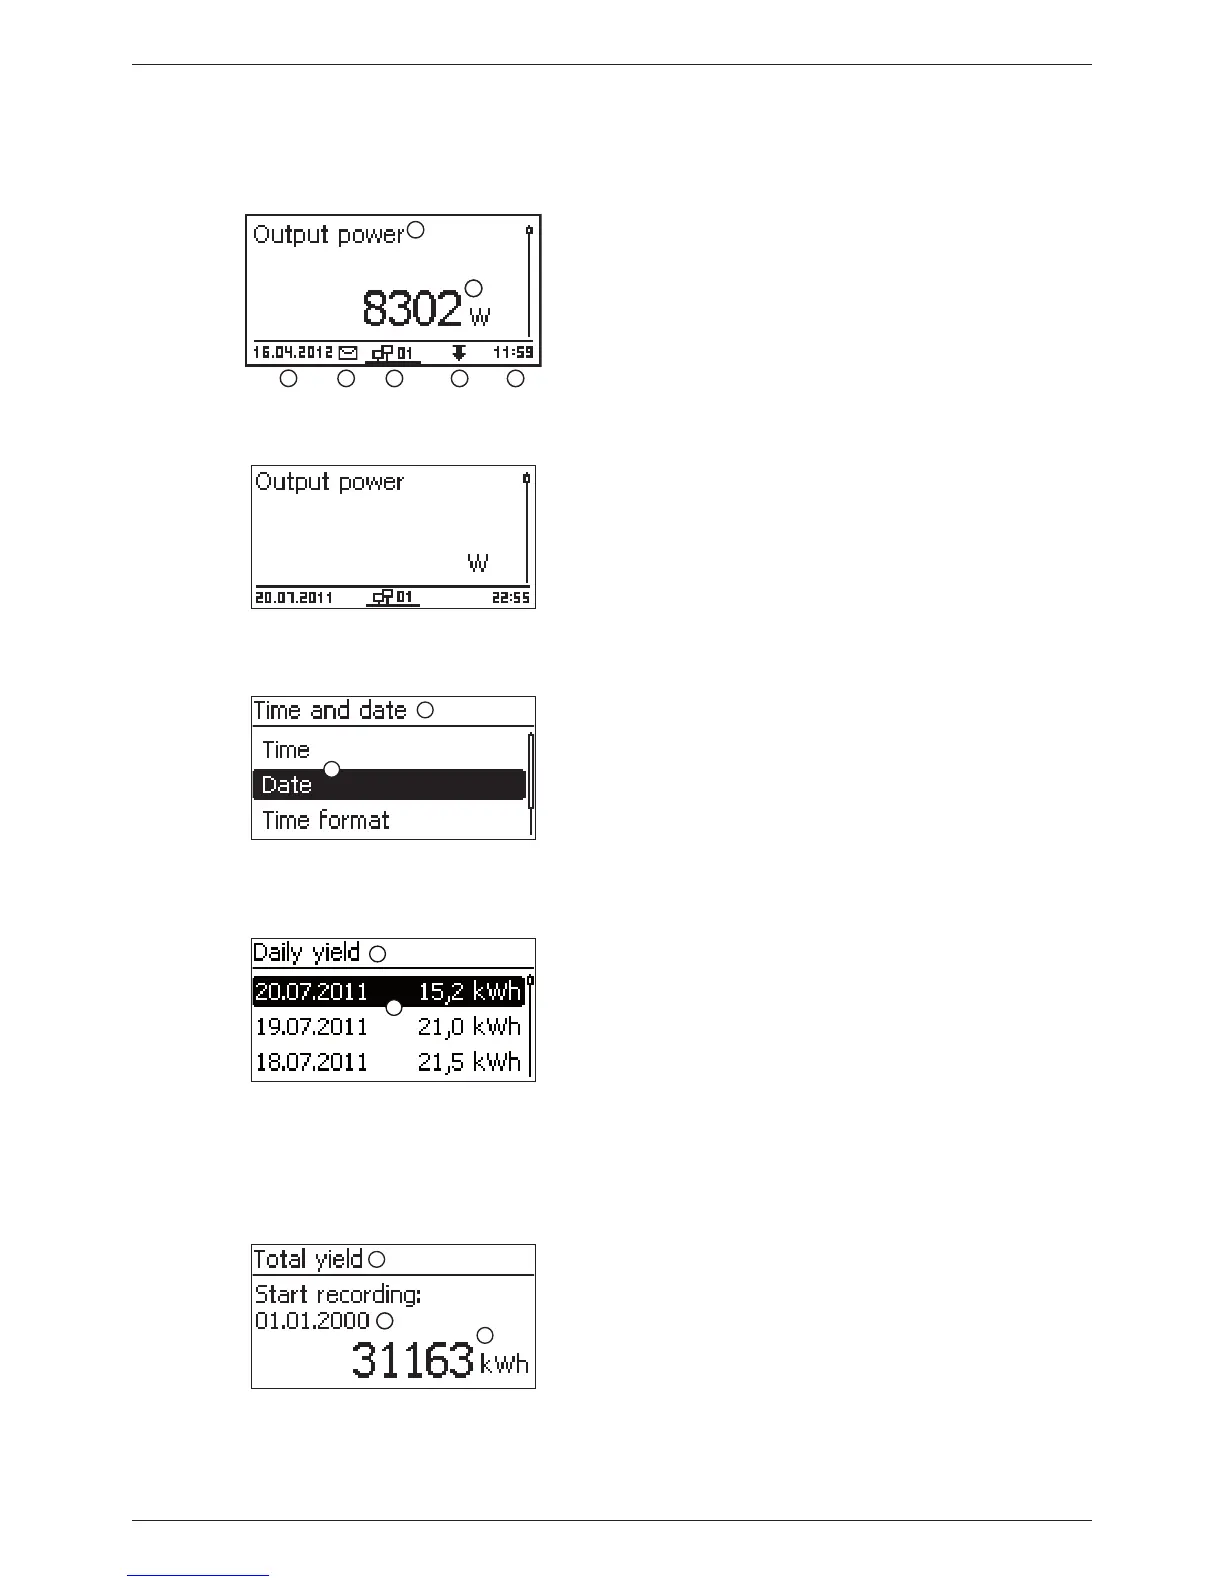
Status display
The status display shows measurements as listed below:
3
4
2
2
75 6
1
Measurement name
Measurement with units
Date
Symbol non-confirmed status messages; more information
on this is provided in Section 11, p. 73.
Animated Connect symbol with 2-digit inverter address;
indicates data traffic on the RS485 bus.
Symbol for Derating
Time
_
The following applies to the status display:
• The measurements shown in the status display are de-
fined under Settings/Measurements. Some measure-
ments are always displayed (default setting).
• Current values are not displayed at night (solar irradiation
too low; example in fig left).
• The CO
2
savings shown in the status display are calcu-
lated using the savings factor 508 g/kWh.
Menu
2
1
Designation of the main/submenu
Menu entries
Numeric yield (day, month, year)
Daily, monthly and annual yields can be displayed numerically in a List.
2
1
Yield period (day/month/year)
Individual yields with period and value (1 per row)
The yield periods contain the following numbers of individual
entries:
Day yield: last 31 days
1)
Monthly yield: last 12 months
1)
Annual yield: last 30 years
1)
1)
A yield value of 0 is shown when the inverter was not yet
installed at this time.
Numeric yield (total yield)
The total yield is displayed in its own window.
3
2
2
1
Yield period for Total yield (all yields since initial commis-
sioning)
Starting point of recording
Total yield with units
49
744.378 | 12.13
EN
 Loading...