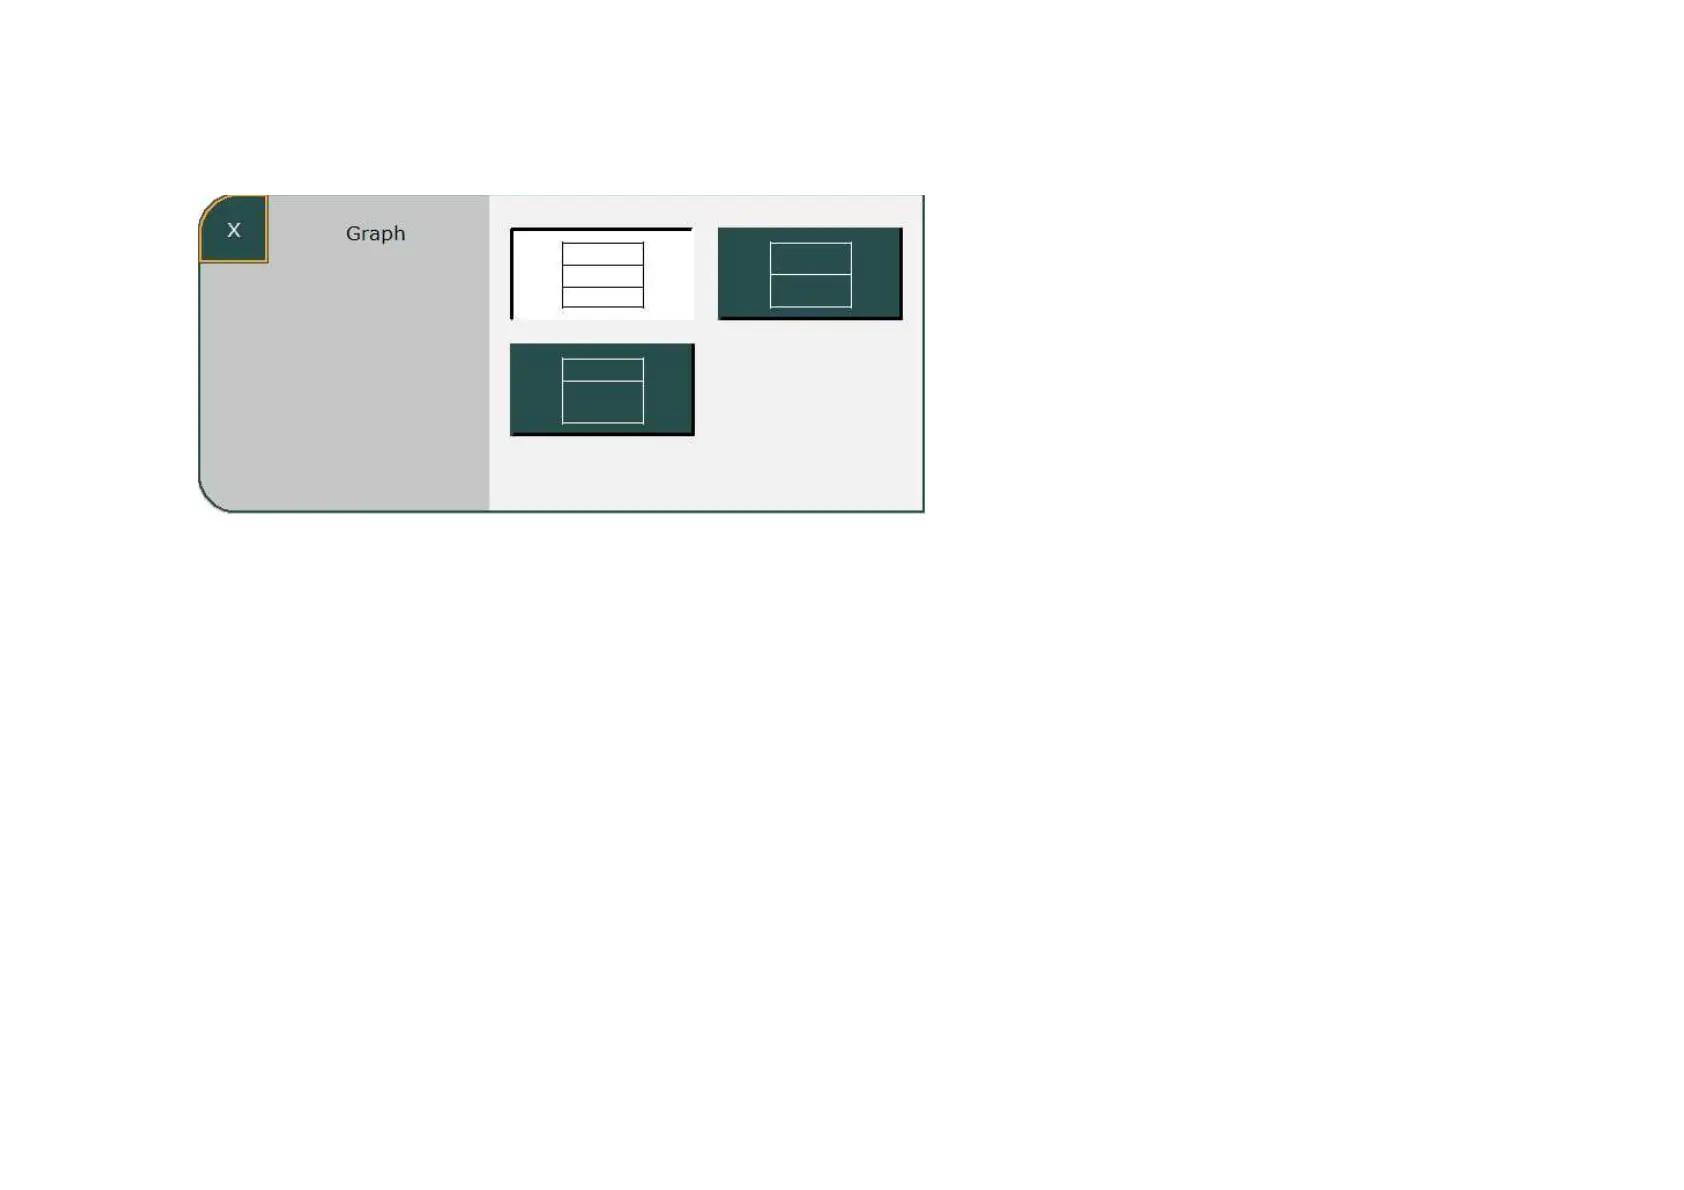
Graphic display
Pressing the „Graph“ button opens the
graphic display, which can be customized.
The initial layout can be pre-configured in
the system settings. Three different layout
versions are available.
1 Display of three curves
2 Display of two curves
3 Display of one curve, loop or trend
The top field of the graphic display always
shows the pressure curve. The remaining
fields can be freely configured by selecting
them.